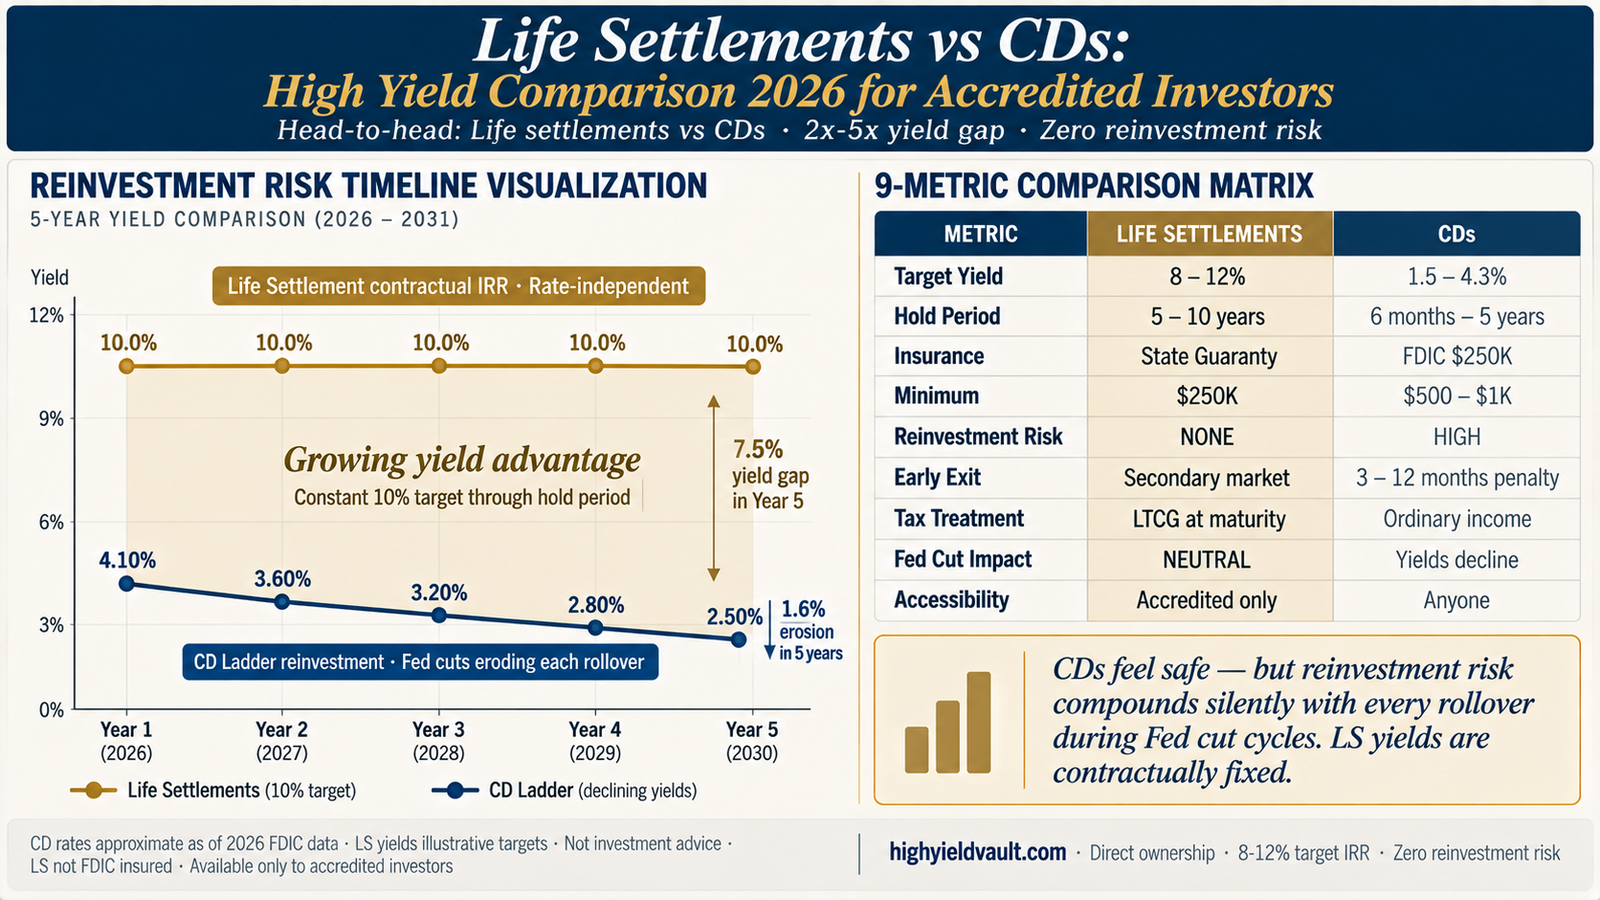
Life settlements target 8-12% IRR with zero reinvestment risk, versus certificates of deposit at current 2026 rates: national average 1-year CD ~1.74-1.96% APY, national average 5-year CD ~1.35-1.70% APY, top promotional 1-year CD ~4.00-4.20% APY (E*TRADE 4.10%), and top promotional 5-year jumbo CD at 4.34% APY (Advancial Federal Credit Union, $50K minimum). The Fed has already cut rates three times in 2026 and CD rates are expected to continue declining through the cycle.
Life settlements deliver approximately 2-3x the yield of top-tier CDs — and the LS yield doesn't decay with every rollover. The death benefit at policy maturity is contractually fixed and doesn't reprice when the Fed cuts rates. CD ladders face compounding reinvestment risk during cut cycles: each maturing rung renews at a progressively lower rate, eroding the ladder's blended yield over time. All returns illustrative; not guaranteed. Life settlements are NOT FDIC insured and are available only to accredited investors per SEC Rule 501. Life settlement investments involve substantial risk including loss of capital.
Browse life settlement policies targeting 2-3x CD yields
Every listing includes LE reports, AM Best carrier ratings, premium schedules, and projected IRR — the data you need to evaluate what a direct-ownership life settlement offers versus a CD maturing in the current Fed cut environment.
Browse available policiesWhy CDs feel safe but hide reinvestment risk
Certificates of deposit have earned their reputation for safety honestly. FDIC insurance covers up to $250,000 per depositor per bank per account category — a federal government backstop that treasuries and life settlements cannot match. Principal is contractually protected (assuming the depositor holds to maturity), and interest accrual is predictable. For many accredited investors, particularly retirees who built CD ladders during the low-rate 2010s, the CD represents the "safe sleeve" of the portfolio — the capital that cannot lose nominal value under normal conditions.
What the safety reputation obscures is reinvestment risk — the risk that when a CD matures, the proceeds must be redeployed at prevailing rates, which may be substantially lower than the rate the matured CD was earning. During rising rate environments (like 2022-2024), reinvestment risk works in the depositor's favor: each maturing CD can be re-laddered at higher rates. During falling rate environments, the dynamic reverses — and the Fed has already executed three rate cuts in 2026 with more expected. A CD ladder structured in 2024 at 5%+ rates will see each 2026-2028 maturity reinvest at progressively lower rates, perhaps 3.5%, then 3%, then 2.5%. Over a full 5-year ladder cycle, the blended yield decays substantially even if initial lock-ins were favorable.
The 2026 CD rate landscape confirms this pattern. National average rates have already declined: 1-year CD national average sits at approximately 1.74-1.96% APY, 5-year national average at 1.35-1.70% APY per FDIC and Bankrate data. Even the top promotional rates (E*TRADE 1-year at 4.10%, Advancial 5-year jumbo at 4.34%) are expected to decline through the Fed cut cycle per industry forecasts. Life settlements target 8-12% IRR with a structurally different mechanism: the death benefit payout at policy maturity is contractually fixed by the underlying insurance policy, independent of prevailing interest rates. LS positions don't face reinvestment risk during their hold period because there's nothing to reinvest — the payout accrues to the single maturity event rather than requiring periodic rate decisions.
Head-to-head: LS vs CDs across 9 metrics
The matrix below compares direct-ownership life settlements against certificates of deposit across the nine metrics that matter most for accredited investors evaluating CD-replacement allocations. Nine metrics covered: target yield, hold period, insurance backing, minimum investment, reinvestment risk, early exit mechanics, tax treatment, Fed cut impact, and accessibility requirements.
CDs feel safe — but reinvestment risk compounds silently with every rollover during Fed cut cycles. LS yields are contractually fixed.
CD rate ranges reflect approximate 2026 data: national average rates per FDIC monthly tracking (1-year CD ~1.74-1.96% APY, 5-year CD ~1.35-1.70% APY as of mid-2026); top promotional rates per Bankrate and GOBankingRates coverage (E*TRADE 1-year 4.10% APY, Advancial Federal Credit Union 5-year jumbo 4.34% APY, $50K minimum). CD rates vary by institution, term, and promotional terms; always verify current rates with the specific institution. FDIC insurance covers up to $250,000 per depositor per insured bank per account ownership category — depositors with balances exceeding $250K at a single institution should structure deposits across multiple institutions or ownership categories to maintain full coverage. Life settlement target IRRs (8-12%) are hypothetical and not guaranteed; actual returns vary based on policy selection, longevity outcomes against life expectancy estimates, carrier credit, and other factors. State guaranty association coverage on underlying life insurance policies varies by state and policy type; typical coverage ranges from $250K to $500K per insured life. Early exit mechanics for LS reference the institutional tertiary market, which provides liquidity but at significant discount to face value in most cases. Tax treatment references federal only; state treatment varies and all investors should consult a qualified CPA.
Which maturing CDs could become LS positions?
Schedule a 20-minute consultation. We'll walk through your current CD ladder structure, map maturity timing against the Fed cut cycle, and show where LS can replace specific maturing rungs for higher yield and reinvestment risk elimination.
Or call (833) 250-9677The reinvestment risk timeline: CD decay vs LS contractual
The matrix above lists the metrics individually. The visualization below shows the compounding reinvestment risk graphically — a 5-year projection of what a CD ladder yield path looks like during a continuing Fed cut cycle versus the LS contractual IRR path that stays constant throughout the hold period.
Flat 10% target IRR throughout 5-year hold · Death benefit contractually fixed · Rate-independent · No rollover decisions required
4.10% → 2.50% projected decay · Each maturing rung reinvests at lower prevailing rate · ~1.6% erosion over 5 years in continuing Fed cut cycle
Reading the timeline: the CD ladder projection assumes a continuing Fed cut cycle consistent with the three rate cuts already executed in 2026 and current forward guidance. The specific decay trajectory (4.10% → 2.50%) is illustrative and reflects a scenario where approximately 160 basis points of additional cuts are implemented through 2030. The LS path (flat 10%) reflects the structural property that LS returns are contractually fixed by the underlying insurance policy death benefit — rate environments do not reprice LS cash flows during the hold period. Over the 5-year horizon, the yield gap between the two paths widens as the CD ladder erodes while LS stays constant. Actual CD rate trajectories depend on Fed policy decisions, inflation dynamics, and other factors — the specific numbers are illustrative, not predictive.
Real walkthrough: Richard's CD-ladder transition
Here's how the LS vs CDs framework applies in practice, illustrated through a composite investor scenario based on the standard pattern for retired professionals with established CD ladders facing Fed cut cycle reinvestment pressure.
Retired teacher · $1.5M CD ladder transitioning portion into LS for yield preservation
Starting position: Richard, a 71-year-old retired high school teacher with $1.9M investable (pension plus accumulated savings plus inheritance), has operated a CD ladder for 20+ years as his "safe sleeve." Current structure: $1.5M across 7 CD positions at 4 different FDIC-insured institutions (keeping each institution below $250K FDIC coverage threshold), staggered maturities 2026-2030, weighted average yield 4.1%. Annual pre-tax interest income: approximately $61,500 across the sleeve, all taxed as ordinary income.
The trigger: $200K in 3-year CDs mature Q2 2026 at a 4.3% rate locked in 2023. Richard calls his credit union to re-ladder — the best available 3-year rate is 3.4%, down 90 basis points from his maturing position. The branch officer confirms the Fed has already cut three times in 2026 with more expected, and advises Richard that waiting likely means worse rates, not better. Richard faces a decision: re-ladder at eroding rates, extend duration for marginal yield pickup (5-year rates only 20bps above 3-year), or evaluate alternatives.
Accredited status check: Richard verifies his accredited investor status (net worth excluding primary residence exceeds $1M per SEC Rule 501). This is the first time in his investing life that the accredited designation is operationally relevant — his CD ladder, treasury holdings, and index fund IRA have all been retail-accessible products. The LS category requires accredited verification to evaluate specific policies.
LS evaluation: Richard reviews the LS vs CDs matrix. At 10% midpoint target IRR, the $200K maturing proceeds would generate approximately $20,000 annual IRR equivalent — roughly 2.4x the $8,500 that a 3-year CD would produce at 3.4%. More importantly: no reinvestment risk during the 7-year LS hold. Richard is more concerned about his sleeve's ability to maintain income through retirement than about principal insurance (the LS state guaranty association coverage is operationally similar to FDIC for his purposes, though technically different).
Allocation decision: Richard commits the $200K maturing proceeds to a single direct-ownership life settlement policy with a 7.3-year LE and a 10.2% target IRR. He maintains the remaining $1.3M CD ladder for near-term liquidity and FDIC-insured safety reserve. Over time (next 2-3 maturities), he plans to transition additional measured amounts if the LS experience validates his comfort with the asset class.
Projected outcome: Richard's $1.5M fixed-income-adjacent sleeve now produces approximately $43K/yr from the remaining $1.3M CD ladder (at projected 3.3% weighted average through continuing cut cycle) PLUS an LS maturity target of $360K-$415K on the $200K position at the 7.3-year horizon (vs $258K that a 3-year CD rollover ladder would produce at 3.4%+ declining rates). Blended effective yield on the full sleeve: approximately 5.0% — a 22% uplift from the straight-CD alternative, while reducing weighted reinvestment risk exposure.
Richard's transition reflects the standard pattern for retired CD-ladder investors facing Fed cut cycle reinvestment pressure. The framework: a measured LS allocation funded from maturing CD proceeds can meaningfully uplift sleeve-level yield while eliminating reinvestment risk on the LS portion — without abandoning the CD ladder's near-term liquidity and FDIC coverage function. The LS cornerstone takes over the longer-duration portion of the sleeve with higher target yield and contractual rate independence; the remaining CD ladder preserves immediate accessibility and federal deposit insurance for the balance.
Get matched with policies for your maturing CD proceeds
Tell us your current CD ladder structure, upcoming maturity schedule, and accredited verification status. We'll show you 2-3 vetted life settlement policies specifically matched to replace specific maturing CD rungs — before you commit anything.
The state guaranty vs FDIC distinction accredited investors need to understand
The single most important educational point for CD-refugee audiences evaluating life settlements is the distinction between FDIC insurance (backing bank CDs) and state guaranty association coverage (backing the underlying life insurance policies in LS positions). These are two different protection mechanisms with different scope, limits, and operational realities. Understanding the difference is essential to accurate LS evaluation versus the CD safety baseline.
FDIC insurance is a federal government backstop that covers deposits at insured banks up to $250,000 per depositor per bank per account ownership category. Coverage is automatic when depositing at an FDIC-insured institution, requires no action by the depositor, and is fully backed by the U.S. government. If an FDIC-insured bank fails, deposits are typically available to depositors within 1-2 business days — the FDIC's track record of making depositors whole is near-perfect. The "feel safe" reputation of CDs is substantially driven by this federal guarantee.
State guaranty associations provide a different protection mechanism for life insurance policies. Each state operates a guaranty association that covers life insurance policies issued by carriers licensed in that state, typically up to coverage limits in the $250K-$500K range per insured life (limits vary by state). Coverage is funded by assessments on other insurance carriers operating in the state, not by federal government guarantee. If a life insurance carrier fails, policy obligations typically transfer to another carrier or are honored through the guaranty association up to the applicable coverage limit. The historical track record of state guaranty associations is strong — no major U.S. life insurance carrier has failed in the three recent recession events (2008 GFC, 2020 COVID, 2022 rate shock) that would have required substantial guaranty association payouts. For a complete framework on event-tested LS performance, see our recession-proof investments scorecard.
The operational implication: direct-ownership LS positions carry carrier credit risk (the specific insurance carrier failing during the hold period) that CDs do not carry (the federal government backing bank deposits is operationally stronger than state-level guaranty backing). HYV mitigates this through carrier selection — all policies on the platform are issued by AM Best A-rated or better carriers, dramatically reducing failure probability during typical hold periods. But accredited investors evaluating LS should understand that the LS "insurance" is state guaranty rather than FDIC, and should weigh that difference accordingly in their defensive sleeve sizing decisions.
See currently available policies targeting 2-3x CD yields
Every listing includes full policy documentation, LE reports from certified underwriters, AM Best carrier ratings, premium projections, and projected IRR. Accredited investor verification per SEC Rule 501 required to view specific policies.
Or call (833) 250-9677Frequently asked questions about life settlements vs CDs
Are life settlements FDIC insured like CDs?
No. Life settlements are not FDIC insured. FDIC insurance applies specifically to deposits at insured banks and credit union deposits (covered by NCUA, the parallel federal insurer for credit unions). Life settlements are investment positions in life insurance policies, not bank deposits — they fall outside the federal deposit insurance framework entirely. The protection mechanism for the underlying life insurance policies is state guaranty association coverage, which is funded by assessments on insurance carriers operating in each state rather than by federal government guarantee. State guaranty association coverage limits typically range from $250K to $500K per insured life depending on state and policy type. HYV mitigates carrier failure risk through selection — all policies on the platform are issued by AM Best A-rated or better carriers, dramatically reducing failure probability during typical hold periods. Accredited investors evaluating LS as a CD-replacement should understand that the LS "insurance" protection is state guaranty rather than federal FDIC, and size allocations accordingly within their defensive sleeve.
What is reinvestment risk and why does it matter for CDs in 2026?
Reinvestment risk is the risk that when a CD matures, the proceeds must be redeployed at prevailing rates — which may be lower than the rate the matured CD was earning. During rising rate environments (like 2022-2024), reinvestment risk works in the depositor's favor: each maturing CD can be re-laddered at higher rates. During falling rate environments, the dynamic reverses — and the Fed has already executed three rate cuts in 2026 with more cuts expected per industry forecasts. A CD ladder structured in 2023-2024 at 5%+ rates will see each 2026-2028 maturity reinvest at progressively lower rates. The national average 1-year CD APY has already declined to approximately 1.74-1.96% per 2026 FDIC data, and even top promotional rates (currently 4.00-4.34% at best-in-class institutions) are expected to continue declining through the cycle. Over a full 5-year ladder cycle, the blended yield can decay substantially — meaningfully reducing annual interest income from the sleeve even without any single CD losing principal. Life settlements eliminate reinvestment risk because the return mechanism is contractual (death benefit at policy maturity) rather than coupon-based — there's nothing to reinvest during the hold period.
Why does the LS category require accredited investor status while CDs don't?
The accredited investor requirement for life settlements reflects SEC regulatory framework under Regulation D Rule 501, which restricts certain private investment categories to accredited investors defined by income or net worth thresholds ($200K individual income, $300K joint income, or $1M net worth excluding primary residence). The reasoning is that accredited investors are deemed to have the financial sophistication and loss tolerance to evaluate and bear the risks of less-liquid, more-complex investment categories without the retail-investor protections that apply to public market products. CDs face no such restriction because they are bank deposits regulated under federal deposit insurance framework — any individual with sufficient funds can open a CD at any FDIC-insured institution. For accredited investors with CD ladders, the practical implication is that LS evaluation requires accredited status verification before specific policies can be reviewed, but once verified, LS access is operationally straightforward. Many retired CD-ladder investors meet accredited thresholds through accumulated savings but have never needed to invoke the accredited designation because retail products (CDs, treasuries, index funds) have met their needs. The CD-to-LS transition is often the first time the accredited status becomes operationally relevant.
Can I exit a life settlement early like I can with a CD?
The exit mechanics are different between the two categories. CDs allow early withdrawal subject to an interest-penalty forfeiture (typically 3-12 months of interest, depending on the CD term and institution policies) — principal is returned, but interest earned to that point is reduced or forfeited. The depositor cannot lose nominal principal via early withdrawal, only forgo interest. Life settlements have no equivalent early withdrawal mechanism from the underlying contract — the death benefit is paid at policy maturity, not at investor request. However, a secondary market (the institutional tertiary market) does exist for LS positions, allowing investors to sell their positions to other institutional buyers before policy maturity. The practical reality: secondary market pricing typically reflects significant discount to projected maturity value (sometimes 60-80% of projected present value depending on remaining LE, carrier credit, and market conditions), meaning early exit from an LS position often involves meaningful principal reduction unlike CD early withdrawal. For accredited investors evaluating LS, the standard assumption should be hold-to-maturity (5-10 years typical) rather than treating LS as a liquid position. This is why LS allocations are typically sized as the longer-duration portion of a sleeve, with CDs or short treasuries maintaining the near-term liquidity function.
How does the tax treatment compare between LS and CDs?
CD interest is taxed as ordinary income in the year it accrues — up to 37% federal plus state taxes for high-bracket investors, pushing effective tax rates on CD interest above 45% in high-tax states. This produces an annual tax drag on CD ladders that compounds against reinvestment at declining rates. Life settlements under IRS Revenue Ruling 2020-05 generally receive long-term capital gains treatment on gain above cost basis for policies held appropriately — the maximum federal LTCG rate is 20% (plus 3.8% NIIT where applicable), substantially lower than the 37% federal ordinary rate on CD interest. Additionally, LS gain recognition typically occurs at policy maturity rather than annually, allowing tax deferral during the hold period (versus CDs where interest is taxed each year it accrues). For high-bracket accredited investors in states with meaningful income taxes, the LS LTCG treatment plus the higher gross yield (8-12% vs 1.5-4.3%) compounds the after-tax advantage significantly. However, LS tax treatment is situation-specific and investors should consult a CPA familiar with the federal 3-tier LS tax framework before deployment.
Should I replace my entire CD ladder with life settlements?
In almost all situations, no — and the framework in this guide doesn't recommend complete replacement. CDs and life settlements serve different functional roles in a retiree's allocation. CDs provide near-term liquidity (positions can be accessed with modest interest penalty), FDIC deposit insurance (federal government backstop), interim cash flow (interest accrues through the term), and a known maturity date for cash flow planning. Life settlements provide back-loaded contractual payment at maturity (5-10 year hold with no interim cash flow from the LS position itself), significantly higher yield (2-3x top CD rates), zero reinvestment risk, and state guaranty association coverage on underlying policies. A balanced approach for most CD-ladder investors is partial replacement: redirect maturing CD proceeds from the longer-duration rungs into LS positions (where the LS hold period roughly matches the longest CD maturity being replaced), while maintaining the short-to-intermediate CD ladder for near-term liquidity and FDIC coverage. This produces sleeve-level yield uplift and reinvestment risk reduction without abandoning the CD ladder's safety and liquidity functions. Specific allocation percentages depend on individual liquidity needs, remaining investment horizon, accredited status, and overall portfolio structure.
Start with the zero-reinvestment-risk entry
Two paths to begin: browse currently available life settlement policies to see what matches your CD maturity timing, or schedule a consultation to walk through the LS vs CDs framework applied to your specific ladder structure and reinvestment schedule.
Or call (833) 250-9677