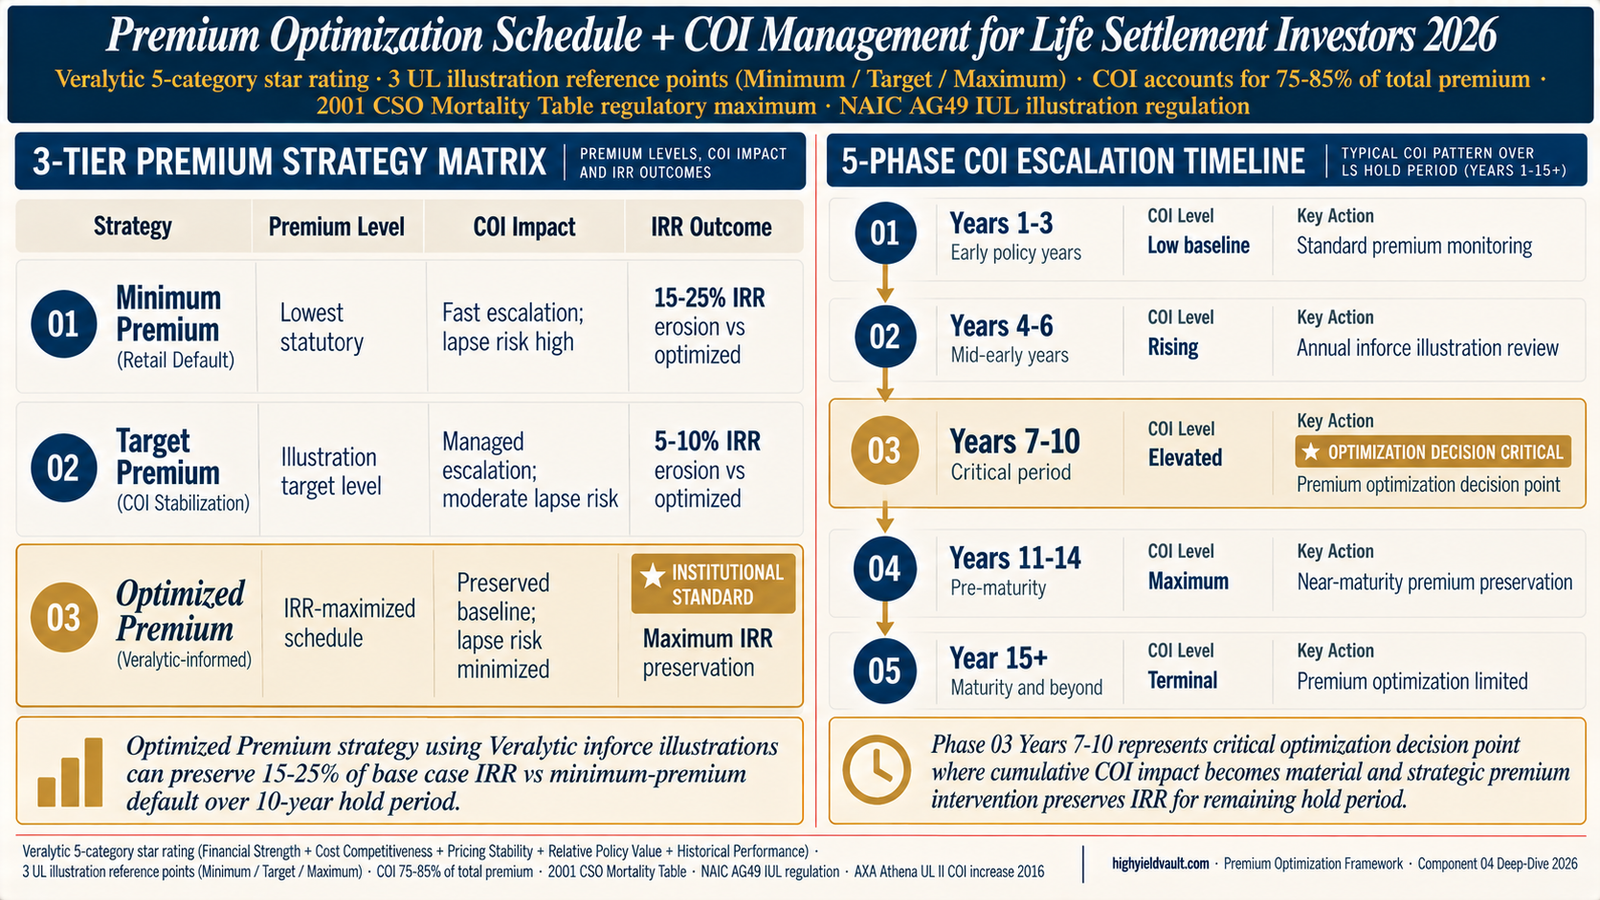
Premium optimization for life settlement investors operates on a 3-tier strategy framework: Tier 01 Minimum Premium (retail default — pay statutory minimum to keep policy in force; builds minimal cash value; rising COI risks lapse before natural maturity); Tier 02 Target Premium (illustration-target level — moderate COI stabilization; balanced carrying cost; moderate lapse risk reduction); Tier 03 Optimized Premium GOLD-HIGHLIGHTED (Veralytic-informed IRR-maximized schedule — institutional standard preserving 15-25% of base case IRR over 10-year hold period vs minimum-premium default). The 5-phase COI escalation timeline tracks cost of insurance impact across LS hold period: Phase 01 Years 1-3 Low Baseline (standard premium monitoring); Phase 02 Years 4-6 Rising (annual inforce illustration review); Phase 03 Years 7-10 Elevated GOLD-HIGHLIGHTED (optimization decision critical — strategic premium intervention preserves IRR); Phase 04 Years 11-14 Maximum (near-maturity premium preservation); Phase 05 Year 15+ Terminal (premium optimization limited).
Industry benchmark data: COI charges account for 75-85% of total premium on standard universal life policies per Veralytic institutional benchmarking. COI escalates annually as insured ages per the carrier's COI table bounded by 2001 CSO Mortality Table regulatory maximum. Veralytic 5-category star rating analyzes policies across Financial Strength, Cost Competitiveness, Pricing Stability, Relative Policy Value, and Historical Performance dimensions — providing "Morningstar for life insurance" analytical framework for premium optimization decisions. Policy types with greatest optimization applicability: UL (Universal Life — most common for LS), VUL (Variable Universal Life), IUL (Indexed Universal Life subject to NAIC AG49 regulation), and GUL (Guaranteed Universal Life with shadow account design). Whole Life policies have less premium flexibility due to bundled premium structure.
See LS policies with Veralytic premium analysis ready for DD
Every HYV listing includes Veralytic policy analysis documentation, premium optimization recommendations, and COI escalation projection prepared for your Component 04 DD execution. Our internal premium optimization analysis precedes platform listing; your independent actuarial review completes position-specific premium strategy design.
Browse available policiesWhy premium optimization preserves 15-25% of base case IRR vs minimum-premium default
The 15-25% IRR preservation benefit of optimized premium strategy vs minimum-premium default reflects the compounding mathematical impact of COI escalation across multi-year hold periods. Industry data confirms COI accounts for 75-85% of total premium on standard universal life policies — meaning the largest single cost component of policy carrying expense is directly tied to insured mortality risk rising annually. Minimum premium strategy that pays only statutory minimum amount creates two compounding problems: (1) policy cash value builds minimally or depletes over time as COI charges exceed premium contributions, creating lapse risk particularly in Phase 03 Years 7-10 when COI escalation becomes material; (2) when policy approaches lapse scenario, investor must inject substantial catch-up premiums at the worst possible time (when COI is already elevated), destroying IRR through punitive late-stage premium injection.
Optimized premium strategy using Veralytic inforce illustration analysis addresses both problems proactively. Rather than paying statutory minimum and accepting IRR erosion from COI compounding, optimized strategy pays slightly above target premium levels during early years when COI is low — building cash value buffer that absorbs COI escalation during later years without triggering lapse risk or requiring punitive catch-up premiums. The additional early-year premium outlay is more than recovered through IRR preservation across the full hold period, producing the documented 15-25% IRR preservation benefit observed in standard institutional LS portfolio analysis.
The Veralytic framework provides the analytical tooling to design optimized premium schedules through its "x-ray" analysis of policy structure. Veralytic benchmarks the specific policy against institutional and retail policy averages across cost of insurance charges, fixed administration expenses, premium loads, and cash-value-based wrap fees. This benchmarking identifies whether policy pricing style is Minimum Premium (defined death benefit focus), Maximum Accumulation (defined contribution focus), or Mixed Funding — each requiring different optimization strategy. For LS investor purposes, Veralytic analysis identifies the specific premium schedule that minimizes total hold-period carrying cost while eliminating lapse risk through optimal cash value buffer management.
The 3-tier premium strategy matrix
The matrix below provides systematic framework for premium strategy selection during Component 04 DD and ongoing hold-period management. Tier 03 Optimized Premium is gold-highlighted as institutional standard representing the IRR-maximized approach using Veralytic-informed premium design.
Optimized Premium strategy using Veralytic inforce illustrations can preserve 15-25% of base case IRR vs minimum-premium default over 10-year hold period.
How does 3-tier premium strategy apply to your position?
Schedule a 20-minute consultation. We'll walk through the 3-tier premium strategy framework applied to your deployment candidates, including Veralytic inforce illustration analysis, COI escalation projection, and strategic premium intervention timing for IRR preservation.
Or call (833) 250-9677The 5-phase COI escalation decision timeline
The timeline below tracks COI escalation impact across LS hold period with recommended monitoring and intervention actions per phase. Phase 03 Years 7-10 is gold-highlighted as critical optimization decision point where cumulative COI impact becomes material and strategic premium intervention preserves IRR for remaining hold period.
Low baseline
Years 1-3Standard premium monitoring. COI charges at baseline levels; cash value building if optimized premium strategy in place; no immediate intervention required. Annual review of premium payment schedule against original Veralytic analysis sufficient. Position in stable early phase of hold period.
Rising escalation
Years 4-6Annual inforce illustration review. COI escalation becoming visible in annual carrier statements; cash value growth rate may slow depending on premium strategy; inforce illustration from carrier recommended annually to project forward trajectory. Minor premium adjustments may be warranted based on inforce illustration findings vs original projection.
Elevated critical
Years 7-10★ Optimization decision critical. Cumulative COI impact becomes material and compounds forward through remainder of hold period. Strategic premium intervention at this phase preserves IRR for remaining 5-10 years; delayed intervention produces punitive catch-up premium injection at worst time. Veralytic reinforce illustration analysis + specialized actuarial consultation recommended at Year 7 inflection as mandatory check.
Maximum near-maturity
Years 11-14Near-maturity premium preservation. COI at or near maximum levels approaching natural policy maturity; premium strategy focused on maintaining policy in force through expected maturity without over-funding; cash value preservation balanced against carrying cost minimization. Semi-annual inforce illustration review recommended.
Terminal limited
Year 15+Premium optimization limited. Position in extended hold scenario beyond typical LE projection; premium strategy focused primarily on maintaining policy in force until natural maturity; optimization flexibility limited; quarterly inforce illustration review recommended. Specialized actuarial consultation if extended hold triggers approaching lapse scenario.
Phase 03 Years 7-10 represents critical optimization decision point where cumulative COI impact becomes material and strategic premium intervention preserves IRR for remaining hold period.
Real walkthrough: Catherine's premium optimization at year 5 inflection
Here's how the 3-tier premium strategy + 5-phase COI timeline framework applies in practice, illustrated through a composite scenario based on standard accredited investor Component 04 premium optimization decision at year 5 hold period inflection using Veralytic inforce illustration analysis.
54-year-old accredited investor · premium optimization decision at year 5 hold period inflection via Veralytic analysis
Starting position: Catherine, a 54-year-old technology executive in Seattle WA, acquired a $650K LS position 5 years ago on an insured female then age 76 (now age 81). Policy: carrier Pacific Life Insurance Company AM Best A+, universal life policy with $1.5M face amount, originally issued 2016 (now 10 years in-force). Original Component 04 DD at acquisition selected Tier 02 Target Premium strategy ($14,500 annual premium against $8,200 minimum). Over past 5 years Catherine has paid $72,500 in premiums ($14,500 × 5 years); current policy cash value approximately $38,000. Catherine is now entering Phase 03 Years 7-10 of her hold period and executes premium optimization reassessment with Veralytic inforce illustration analysis plus Milliman actuarial consultation per the Component 04 framework.
Veralytic 5-category star rating analysis: Catherine's team orders Veralytic inforce illustration analysis of her current Pacific Life policy. Report confirms policy in Institutional classification with 4-star overall rating. Financial Strength: 5 stars (Pacific Life A+ carrier credit confirmed via Day 113 Carrier Credit framework). Cost Competitiveness: 4 stars (COI charges below Veralytic institutional average; premium loads at institutional average; fixed administration expenses slightly above average). Pricing Stability: 3 stars (COI increases possible in future per Pacific Life pattern similar to AXA Athena UL II 2016 cautionary tale; no current announced increase but monitoring warranted). Relative Policy Value: 4 stars (policy value preserved vs peer policies in Veralytic database). Historical Performance: 4 stars (actual COI escalation tracking slightly favorable to original 2016 illustration).
3-Tier Premium Strategy evaluation: Milliman actuarial team evaluates Catherine's current Tier 02 Target Premium strategy against alternative Tier 01 Minimum and Tier 03 Optimized approaches for remaining 7-year expected hold period. Tier 01 Minimum ($8,200/year): policy would deplete cash value within 4 years, triggering lapse scenario at year 9 of 12-year expected hold — unacceptable. Tier 02 Target ($14,500/year — current approach): policy would maintain through year 11 but tight on cash value in final 2 years; moderate lapse risk. Tier 03 Optimized ($17,800/year — Veralytic recommended): policy maintains comfortable cash value buffer through expected maturity; lapse risk minimized; IRR preserved despite higher premium outlay. Optimized strategy preserves projected 14.2% IRR vs 11.9% IRR under current Target strategy — 2.3 percentage point IRR preservation ($15,000+ incremental return over remaining hold period).
Decision analysis: Catherine evaluates incremental cost ($17,800 − $14,500 = $3,300 incremental annual premium × 7 remaining years = $23,100 incremental total outlay) vs IRR preservation benefit ($15,000+ incremental return per Milliman projection). Catherine's family office tax context: $3,300 incremental annual premium represents additional 1.4% increase in position carrying cost, offset by $15,000+ IRR preservation. Clear positive expected value from Tier 03 Optimized transition. Secondary benefit: reduced lapse risk eliminates tail scenario where catch-up premiums would be required under Tier 02 approach.
Implementation: Catherine transitions to Tier 03 Optimized Premium strategy effective policy year 11 (next premium payment date). Annual inforce illustration review scheduled for ongoing Phase 03 monitoring. Updated Veralytic analysis scheduled annually to track trajectory vs projection. Specialized Milliman actuarial consultation retainer established for ongoing hold-period support. Component 04 premium optimization transition complete; IRR preservation projected across remaining 7-year expected hold through natural maturity.
Catherine's walkthrough reflects systematic accredited investor Component 04 premium optimization decision at Phase 03 Years 7-10 inflection point. The framework: 3-tier premium strategy evaluation using Veralytic 5-category star rating analysis identifies IRR-preserving premium schedule; comparing incremental premium cost against IRR preservation benefit produces positive expected value decision for Optimized strategy; specialized actuarial consultation enables sophisticated analysis beyond standard framework application. Standard institutional practice treats annual Veralytic inforce illustration review as mandatory monitoring protocol with specialized actuarial consultation at Phase 03 inflection ($3K-$8K typical consultation cost acceptable screening investment for multi-year hold position with material IRR at stake).
Get matched with Veralytic-analyzed policies for your DD
Tell us your premium strategy preferences, hold period horizon, and position size parameters. We'll show you 2-3 vetted life settlement policies with Veralytic 5-category analysis documentation ready for your independent Component 04 premium optimization DD execution.
When premium optimization requires specialized actuarial engagement beyond standard framework
The 3-tier premium strategy and 5-phase COI timeline framework provide operational guidance for standard Component 04 premium optimization. However, certain scenarios involve complexity requiring expanded specialized actuarial engagement beyond standard framework application.
Four scenarios requiring expanded specialized actuarial engagement beyond standard premium optimization
1. VUL or IUL policies with investment-linked crediting complexity. Variable Universal Life (VUL) policies with underlying investment sub-accounts and Indexed Universal Life (IUL) policies with index-linked crediting rates subject to NAIC AG49 illustration regulation require specialized actuarial analysis beyond standard UL framework. VUL analysis requires sub-account performance assumptions, M&E (mortality and expense) wrap fee calculation, and investment return volatility modeling. IUL analysis requires understanding of crediting cap/participation rate/floor structure, hedging budget mechanics (which Veralytic does not examine per standard disclaimer), and AG49 compliance validation. Standard 3-tier framework provides starting point but requires specialized actuarial engagement with VUL/IUL expertise for policy-specific optimization.
2. GUL policies with shadow account design complexity. Guaranteed Universal Life (GUL) policies with shadow account design require specialized analysis because policy performance depends on shadow account value calculation contained only in policy contract (not in standard illustration). Shadow account mechanics determine no-lapse guarantee duration; incorrect premium strategy can inadvertently trigger shadow account depletion causing loss of guarantee. Veralytic standard analysis does not review shadow account calculations per published methodology; specialized actuarial engagement required for GUL optimization including shadow account projection and no-lapse guarantee preservation analysis.
3. Carrier COI increase scenarios (AXA Athena UL II 2016 pattern and similar). Life insurance carriers occasionally announce COI rate increases on existing policies within statutory and contractual bounds. The AXA Athena UL II 2016 announced COI increase represents industry-recognized cautionary tale affecting certain Athena Universal Life II policies starting January 2016. Similar scenarios have occurred with other carriers on specific policy series. When carrier announces COI increase affecting LS portfolio policies, specialized actuarial engagement required to assess: (a) revised premium requirements under new COI schedule; (b) revised IRR projection reflecting elevated carrying cost; (c) secondary market disposition evaluation vs continued hold; (d) regulatory challenge options if COI increase appears outside contractual bounds. These scenarios can materially affect position economics requiring immediate specialized analysis.
4. Non-recourse premium financing structures. Policies with non-recourse premium financing (where insured borrowed premiums without personal recourse obligation) create complex premium optimization scenarios. Financing arrangement terms affect which party is responsible for premium payments, how cash value is pledged as collateral, and how death benefit proceeds are distributed between financing lender and LS investor at natural maturity. Premium optimization must coordinate with financing structure to avoid triggering collateral deficiency scenarios or lender foreclosure on policy. Specialized actuarial engagement required with experience in premium financing structures beyond standard Component 04 framework.
For investors in these four specialized scenarios, standard 3-tier + 5-phase framework provides starting point but requires expanded specialized actuarial engagement with policy-type-specific expertise. HYV coordinates specialized actuarial referrals for complex premium optimization scenarios including VUL/IUL expertise, GUL shadow account analysis, carrier COI increase response, and non-recourse premium financing coordination.
See Veralytic-analyzed policies ready for premium DD
Every listing includes Veralytic 5-category star rating documentation, premium optimization recommendations, and COI escalation projection prepared for your Component 04 DD execution. Our internal premium optimization analysis precedes platform listing; your independent actuarial review completes position-specific DD.
Or call (833) 250-9677Frequently asked questions about premium optimization + COI management
What's the difference between Minimum, Target, and Maximum premium on a UL illustration?
Every universal life (UL) illustration includes three premium reference points representing distinct policy funding strategies. Minimum Premium: The lowest premium amount required to keep policy in force for the short term; builds little or no cash value; pay only this and rising cost of insurance (COI) may cause policy to lapse later. Minimum premium is the statutory floor permitting policy to remain active but offers no buffer against COI escalation. For retail policyholders unable to afford higher premiums, minimum premium is survival strategy; for institutional LS investors, minimum premium creates unacceptable lapse risk and IRR erosion. Target Premium: The illustration target level recommended by the carrier for standard policy performance; builds moderate cash value over time; moderate buffer against COI escalation. Target premium represents middle-ground approach balancing carrying cost against lapse risk. For LS investor purposes, Target Premium is baseline acceptable but suboptimal — represents starting point before Veralytic optimization analysis. Maximum Premium: The highest premium amount permissible before policy becomes Modified Endowment Contract (MEC) under IRC §7702A rules; builds maximum cash value accumulation; provides maximum buffer against COI escalation but may exceed optimization sweet spot. Maximum premium is relevant for cash accumulation strategies (not typical LS investor use) and establishes upper bound for premium optimization analysis. Optimization sweet spot (institutional standard): Veralytic-informed premium schedule typically sits between Target and Maximum premium levels, calibrated to specific policy characteristics (COI schedule, policy expense structure, projected hold period, insured age/mortality profile) to produce IRR-maximized schedule for LS investor hold scenario.
How does Veralytic analysis actually work for LS premium optimization?
Veralytic provides institutional-grade policy analysis functioning as "Morningstar for life insurance" per founder Barry Flagg's design philosophy. For LS investor premium optimization, Veralytic analysis provides these core functions. 5-Category Star Rating: Each policy rated 1-5 stars across Financial Strength (carrier credit quality — overlapping with Component 03 Carrier Credit DD per Day 113 framework), Cost Competitiveness (COI + fixed administration expenses + premium loads vs institutional benchmarks), Pricing Stability (likelihood of future COI increases based on carrier pattern and policy structure), Relative Policy Value (overall policy value vs peer policies in Veralytic database), and Historical Performance (actual policy performance vs original illustration). Policy Classification: Policies classified by target market (Retail / Institutional / Experience-Rated) and optimal funding strategy (Minimum Premium/Defined Death Benefit / Maximum Accumulation/Defined Contribution / Mixed Funding Strategy). For LS investor purposes, Institutional classification with Minimum Premium or Mixed Funding strategy is typical target. Expense "X-Ray" Analysis: Benchmarks policy expenses (COI charges, fixed administration expenses, premium loads, cash-value-based wrap fees) against industry averages for institutional and retail pricing. Identifies specific cost structure components warranting optimization attention. Inforce Illustration Analysis: Projects forward policy performance under alternative premium scenarios enabling comparison of Minimum vs Target vs Optimized premium strategies with specific cash value trajectory and lapse risk projection. Investor action implications: Veralytic reports typically cost $200-$500 per policy; annual inforce illustration review recommended as standard institutional protocol; specialized actuarial consultation may complement Veralytic analysis for complex scenarios (VUL/IUL/GUL per specialized scenario framework). HYV coordinates Veralytic analysis for platform-presented policies as component of institutional DD.
Why do COI charges account for 75-85% of total premium?
Cost of insurance (COI) charges represent the pure mortality cost of the death benefit protection — the net amount at risk (death benefit minus cash value) multiplied by a mortality rate per the carrier's COI table. COI dominates total premium cost on standard universal life policies for these structural reasons. Mortality cost structure: Life insurance fundamentally pays death benefit at insured death; the actuarial cost of this payout obligation grows annually as insured ages and mortality probability increases. COI table escalation: Carrier COI tables (bounded by 2001 CSO Mortality Table regulatory maximum) escalate COI charges each year with insured age increase; by insured age 80+, annual COI charges can be 10-20x the baseline charges at insured age 60. Expense allocation: Policy expenses beyond COI include fixed administration expenses, premium loads, and cash-value-based wrap fees — but these typically account for only 15-25% of total premium cost compared to COI's 75-85% share. For LS investor significance: Understanding COI dominance explains why premium optimization is critical for IRR preservation. Minimum premium strategy that fails to cover escalating COI charges requires cash value depletion to fund COI shortfall — eventually triggering lapse when cash value exhausts. Target premium strategy covers COI escalation moderately but may struggle in later years. Optimized premium strategy builds early-year cash value buffer that absorbs COI escalation efficiently without lapse risk. The 15-25% IRR preservation benefit of Optimized vs Minimum reflects elimination of catch-up premium injection timing penalty + lapse risk elimination. COI table transparency per Veralytic analysis: Standard Veralytic report breaks out COI charges separately from other expense components, enabling precise optimization analysis. Carrier illustrations include COI charge projections across policy duration — critical input for premium strategy design. For LS investor DD: annual inforce illustration review tracks actual COI escalation vs original projection to identify COI increase scenarios (AXA Athena UL II 2016 pattern) warranting specialized response.
What happens if a carrier announces a COI increase on my LS portfolio policies?
Carrier-announced COI increases on existing policies represent one of the identifiable risks that systematic Component 04 Premium Optimization DD aims to monitor but cannot prevent. Historical precedent: The AXA Athena UL II COI increase announced for January 2016 affecting certain Athena Universal Life II policies represents industry-recognized cautionary tale demonstrating that carrier COI increases do occur within statutory and contractual bounds. Similar scenarios have occurred with other carriers on specific policy series. Standard institutional response framework when carrier COI increase announced: Step 1 — Immediate review of affected policies: identify all LS portfolio policies subject to announced increase; obtain detailed increase schedule from carrier; coordinate with HYV platform for aggregated impact analysis if multiple portfolio positions affected. Step 2 — Revised actuarial projection: engage specialized actuarial consultation to project revised premium requirements under new COI schedule and recalculated IRR scenarios; typical analysis cost $3K-$8K per affected position. Step 3 — Position disposition evaluation: for each affected position evaluate (a) continued hold with revised premium strategy accepting IRR reduction; (b) secondary market sale at adjusted pricing reflecting new COI schedule; (c) policy surrender if secondary market unavailable or uneconomical. Step 4 — Potential regulatory challenge: review whether COI increase conforms to contractual terms and 2001 CSO Mortality Table regulatory maximum; if increase appears to exceed contractual bounds, evaluate legal challenge through state insurance regulator complaint and/or litigation; several industry-wide COI increase announcements have faced successful regulatory and legal challenges reducing or reversing announced increases. Step 5 — Portfolio-level impact assessment: calculate aggregate portfolio impact across all affected positions; evaluate rebalancing or defensive positioning for forward deployments if specific carrier shows pattern of COI increases. Portfolio-level implication: multiple positions with same carrier amplify exposure to carrier-specific COI increase risk; portfolio concentration limits per Day 113 Carrier Credit framework also mitigate COI increase concentration risk. HYV coordinates COI increase monitoring across platform-presented positions with recommended action analysis including specialized actuarial consultation referrals.
How often should I review premium strategy on my LS portfolio?
Standard institutional protocol for ongoing premium strategy review during LS hold period follows cadence calibrated to the 5-phase COI escalation timeline framework. Phase 01 Years 1-3 (Low Baseline): Annual review sufficient; focus on confirming actual premium payment aligns with original Component 04 DD strategy; verify no missed premium payments triggering lapse notice; cash value trajectory matching original Veralytic projection. Phase 02 Years 4-6 (Rising): Annual inforce illustration review recommended; order inforce illustration from carrier annually; compare actual trajectory vs original 2016 illustration vs updated Veralytic projection; identify any variance warranting investigation; minor premium adjustments may be warranted based on findings. Phase 03 Years 7-10 (Elevated — Critical): Annual Veralytic reinforce illustration + specialized actuarial consultation recommended at Year 7 inflection as mandatory check; strategic premium intervention decision at this phase preserves IRR for remaining hold period; delayed intervention produces punitive catch-up premium injection at worst time; this is the critical optimization decision window per the framework. Phase 04 Years 11-14 (Maximum — Near-Maturity): Semi-annual inforce illustration review recommended; premium strategy focused on maintaining policy in force through expected maturity; cash value preservation balanced against carrying cost minimization. Phase 05 Year 15+ (Terminal): Quarterly inforce illustration review recommended for extended hold positions; premium strategy focused primarily on maintaining policy in force until natural maturity; specialized actuarial consultation if extended hold triggers approaching lapse scenario. Additional review triggers (any phase): carrier announces COI increase (AXA Athena UL II 2016 pattern); material change in insured health status affecting LE projection; secondary market pricing favorable for disposition evaluation; carrier M&A or regulatory event affecting policy obligations; portfolio-level considerations warranting cross-position review. HYV coordinates ongoing premium optimization review across platform-presented positions with annual Veralytic analysis and specialized actuarial consultation referrals at Phase 03 inflection as standard institutional service.
Do VUL and IUL policies require different premium optimization analysis than standard UL?
Yes — Variable Universal Life (VUL) and Indexed Universal Life (IUL) policies require specialized actuarial engagement beyond standard UL framework due to additional structural complexity. VUL (Variable Universal Life) differences: Premium not only covers COI + policy expenses but also funds investment sub-accounts selected by policyholder; investment return variance directly affects cash value accumulation and lapse risk; M&E (mortality and expense) wrap fees apply as cash-value-based charges in addition to standard policy expenses; FINRA Rule 2210 restricts certain comparisons involving VUL policies limiting standard benchmarking analysis. Specialized VUL analysis requires: sub-account performance assumption modeling (typically conservative projections like 0% / 4% / 8% scenarios), M&E wrap fee calculation in total cost analysis, and investment return volatility impact on premium optimization. IUL (Indexed Universal Life) differences: Cash value credited based on index performance (typically S&P 500 or similar) subject to crediting cap, participation rate, and floor structure; carrier hedges index exposure through options-based strategies with hedging budget constraints; NAIC AG49 regulation (adopted 2015) governs IUL illustration crediting rate assumptions to curb overly optimistic projections; AG49 revisions have been proposed to address ongoing illustration concerns. Specialized IUL analysis requires: understanding of hedging budget mechanics (which Veralytic does not examine per published disclaimer), AG49-compliant crediting rate assumption validation, index strategy risk assessment, and cap/participation/floor structure impact on cash value accumulation. GUL (Guaranteed Universal Life) differences: Shadow account design determines no-lapse guarantee duration; shadow account mechanics contained only in policy contract (not in standard illustration); Veralytic standard analysis does not review shadow account per published methodology. Specialized GUL analysis requires actuarial engagement with shadow account expertise. Investor action implications: policies with VUL, IUL, or GUL structure require specialized actuarial engagement beyond standard Component 04 framework; standard $3K-$8K actuarial consultation typically appropriate for standard VUL/IUL analysis; GUL shadow account analysis may require additional expertise ($5K-$15K). HYV coordinates specialized actuarial referrals with policy-type-specific expertise for complex premium optimization scenarios.
Start with Veralytic-analyzed policies
Two paths to begin: browse currently available life settlement policies with pre-executed Veralytic 5-category analysis including premium optimization recommendations, or schedule a consultation to walk through 3-tier premium strategy framework application to your deployment strategy and hold-period management.
Or call (833) 250-9677