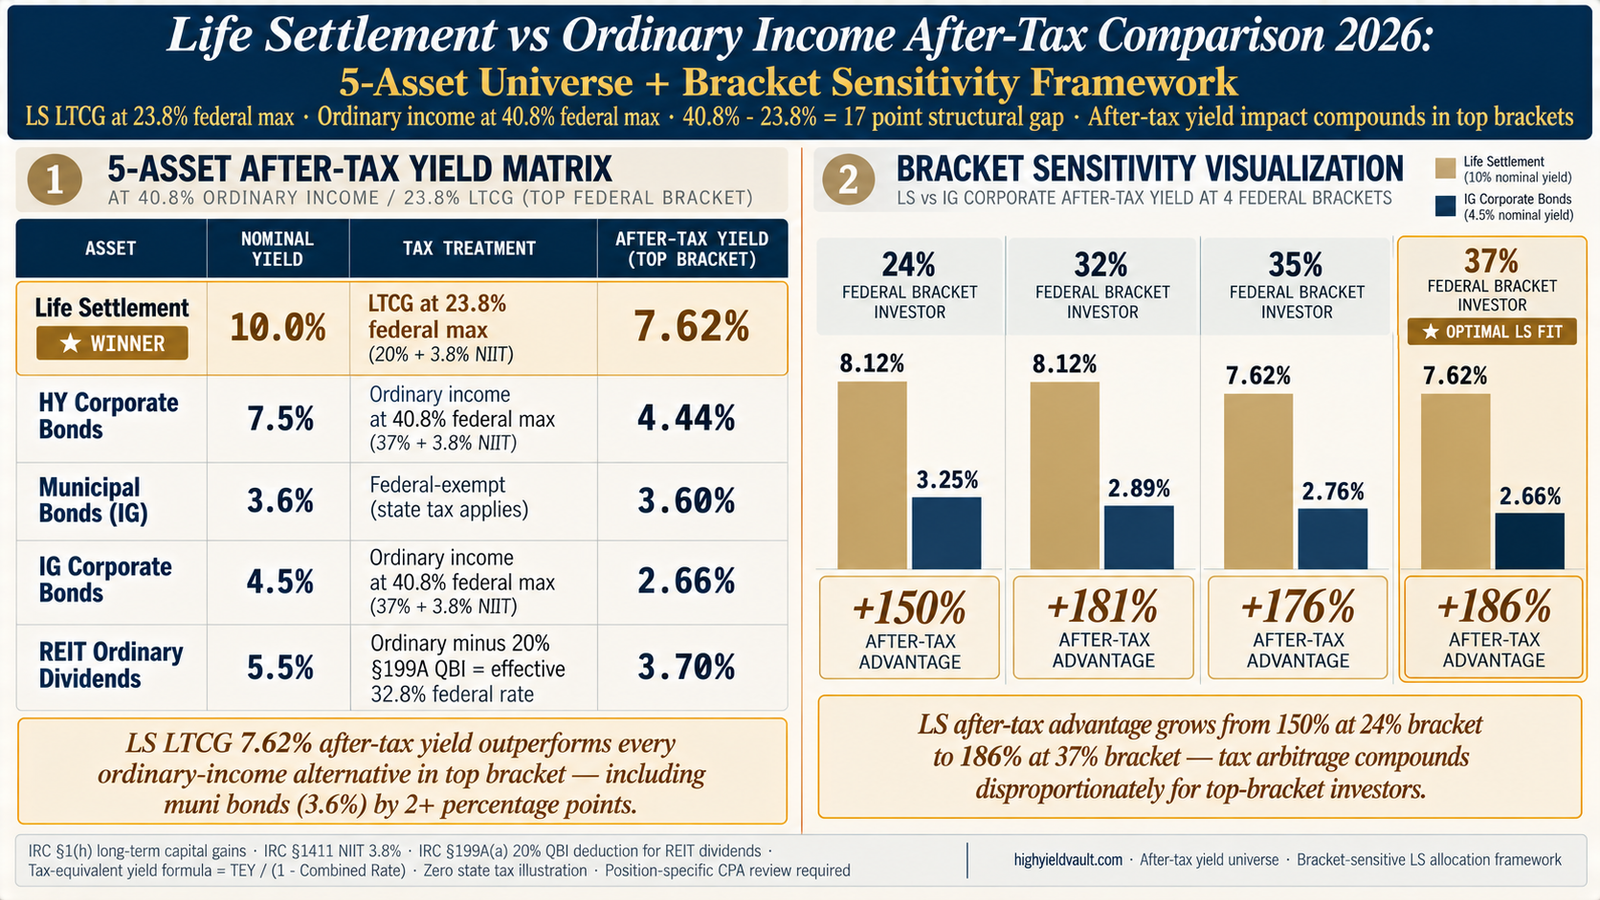
At the top federal tax bracket (37% ordinary / 20% LTCG + 3.8% NIIT in both cases), life settlement positions taxed as LTCG produce 7.62% after-tax yield on a 10% gross target IRR, dramatically outperforming all 5 institutional ordinary-income alternatives: IG corporate bonds 2.66% after-tax (on 4.5% nominal), HY corporate bonds 4.44% after-tax (on 7.5% nominal), municipal bonds 3.60% after-tax (on 3.6% nominal — federal-exempt), REIT ordinary dividends 3.70% after-tax (on 5.5% nominal after 20% §199A QBI deduction producing effective 32.8% rate), and bank CDs typically 2.37-3.08% after-tax (on 4-5% nominal). The structural reason: ordinary income gets taxed at 40.8% maximum federal rate (37% ordinary + 3.8% NIIT), while LTCG receives preferential treatment at 23.8% maximum (20% LTCG + 3.8% NIIT) — a 17-percentage-point rate gap that creates substantial after-tax yield advantage for LS positions versus any ordinary-income alternative.
The LS after-tax advantage grows disproportionately for higher-bracket investors through bracket sensitivity analysis. At the 24% federal bracket (ordinary 27.8% / LTCG 18.8%): LS after-tax 8.12% vs IG corp 3.25% = +150% advantage. At the 32% federal bracket (ordinary 35.8% / LTCG 18.8%): LS 8.12% vs IG corp 2.89% = +181% advantage. At the 35% federal bracket (ordinary 38.8% / LTCG 23.8%): LS 7.62% vs IG corp 2.76% = +176% advantage. At the 37% federal bracket (ordinary 40.8% / LTCG 23.8%): LS 7.62% vs IG corp 2.66% = +186% advantage. For investors in the 32%+ brackets, the LS structural tax arbitrage represents a transformational portfolio allocation advantage versus traditional income-focused alternatives. Position-specific CPA review essential before relying on bracket-sensitive after-tax projections.
Browse life settlement policies for after-tax yield allocation
Every listing includes documentation for CPA coordination on LTCG classification and bracket-specific after-tax yield projection for your federal + state tax situation.
Browse available policiesWhy ordinary-income alternatives struggle for high-bracket investors
The fundamental math driving the LS structural advantage versus ordinary-income alternatives is the 17-percentage-point rate gap between the top ordinary income rate (40.8% federal: 37% ordinary + 3.8% NIIT) and the top long-term capital gain rate (23.8% federal: 20% LTCG + 3.8% NIIT). This gap creates asymmetric tax drag on investment returns depending on how those returns are classified for federal income tax purposes. Ordinary income — including interest from corporate bonds, interest from Treasuries (though state-exempt), REIT ordinary dividends, bank CD interest, and most private credit distributions — is subject to the full ordinary income rate structure at the investor's marginal bracket. For a top-bracket investor in the 37% federal bracket, every dollar of ordinary interest income converts to only 59.2 cents of after-tax income (reduced further by state tax in non-zero-tax states).
Long-term capital gains, in contrast, receive preferential treatment under IRC §1(h) at 15% or 20% depending on bracket, plus the 3.8% NIIT per IRC §1411 for high-income taxpayers. The top LTCG combined rate of 23.8% means every dollar of LTCG income converts to 76.2 cents of after-tax income — a 29% improvement in after-tax conversion efficiency versus ordinary income at the same bracket. For investments producing 10% gross returns (such as LS target IRR), this translates to 7.62% after-tax yield for LTCG classification versus 5.92% after-tax yield if the same returns were taxed as ordinary income — a +28.7% uplift in after-tax yield from favorable tax classification alone.
The after-tax yield advantage compounds when comparing LS to ordinary-income alternatives with lower nominal yields (which is the typical market reality — investment-grade bonds, municipal bonds, and most income-focused alternatives offer lower pre-tax yields than LS target IRR). A 10% LS gross IRR producing 7.62% after-tax is competing against 4.5% IG corporate bonds producing 2.66% after-tax (at top bracket) — the after-tax yield gap is 4.96 percentage points, representing +186% after-tax advantage per allocated dollar. For $500K deployed, this translates to approximately $24,800 annual after-tax yield difference ($38,100 LS vs $13,300 IG corporate bonds). Compounded over 10-year hold periods, the after-tax yield advantage represents substantial cumulative wealth-building divergence for top-bracket investors.
The 5-asset after-tax yield matrix at top federal bracket
The matrix below compares life settlement positions against the 4 most common institutional income alternatives at the 37% top federal bracket (40.8% combined ordinary / 23.8% combined LTCG). All after-tax yields illustrated at zero state tax for comparability — actual yields vary by state residence per our Day 102 state tax framework.
LS LTCG 7.62% after-tax yield outperforms every ordinary-income alternative at top bracket — including muni bonds (3.60%) by 4+ percentage points and IG corporate bonds (2.66%) by nearly 5 percentage points.
How does after-tax yield optimization fit your portfolio allocation?
Schedule a 20-minute consultation. We'll walk through your current income-focused allocation across bonds, REITs, and other alternatives, model after-tax yield replacement with LS positions, and coordinate with your CPA on bracket-specific projection documentation.
Or call (833) 250-9677The bracket sensitivity visualization: how LS advantage scales
The LS structural tax advantage versus ordinary-income alternatives is not uniform across all investor brackets — it grows disproportionately for higher-bracket investors because the ordinary income rate progression outpaces the LTCG rate progression at upper brackets. The 4-bracket visualization below shows LS after-tax yield (gold) versus IG corporate bond after-tax yield (navy) at each federal bracket, with the advantage percentage calculated for each tier.
Mid-income investor ($191K-$244K single)
Upper-income investor ($244K-$609K single)
High-income investor ($609K-$731K single)
Top bracket investor (>$731K single)
LS after-tax advantage grows from +150% at 24% bracket to +186% at 37% bracket — tax arbitrage compounds disproportionately for top-bracket investors.
Real walkthrough: Marcus's $500K multi-asset after-tax comparison
Here's how the 5-asset comparison framework applies in practice, illustrated through a composite scenario based on the standard pattern for top-bracket investors evaluating LS versus existing income-focused allocation alternatives.
56-year-old top-bracket tech executive · $500K deployment comparison across 5 options
Starting position: Marcus, a 56-year-old tech company CFO in Texas (zero state tax, 23.8% federal LTCG only on applicable gains, 40.8% federal ordinary on applicable income), has $4.8M portfolio seeking $500K additional income-focused allocation. His current allocation: $1.6M public equities, $1.2M private equity LP interests, $800K muni bonds, $700K cash + bank CDs, $500K bank account liquidity. His financial advisor recommends increasing income-focused allocation by $500K from existing cash reserves; the question is which asset class offers optimal after-tax yield for his specific tax situation.
5-asset comparative analysis: Marcus's CPA + financial advisor model five deployment scenarios, each at the top-bracket after-tax rates applicable to Marcus. Option 1 (Life Settlement): $500K deployed in direct-ownership LS positions, projected 10% gross IRR, LTCG at 23.8% federal (TX zero state) = 7.62% after-tax yield = $38,100 annual after-tax yield equivalent. Option 2 (HY Corporate Bonds): $500K in HY bond fund yielding 7.5% nominal, ordinary at 40.8% = 4.44% after-tax = $22,200 annual. Option 3 (REIT Ordinary Dividends): $500K in diversified public REIT allocation yielding 5.5%, ordinary with §199A QBI effective 32.8% = 3.70% after-tax = $18,500 annual. Option 4 (Muni Bonds IG): $500K in IG muni bond ladder yielding 3.6% nominal federal-exempt = 3.60% after-tax = $18,000 annual. Option 5 (IG Corporate Bonds): $500K in IG corporate bond fund yielding 4.5%, ordinary at 40.8% = 2.66% after-tax = $13,300 annual.
Comparative after-tax outcome: Marcus's analysis reveals the LS option producing substantially higher after-tax yield than any ordinary-income alternative. LS advantage versus closest competitor (HY corporate bonds): +71% higher after-tax yield ($38,100 vs $22,200 = $15,900 annual advantage). LS advantage versus muni bonds: +112% higher after-tax yield ($38,100 vs $18,000 = $20,100 annual advantage). LS advantage versus IG corporate bonds: +186% higher after-tax yield ($38,100 vs $13,300 = $24,800 annual advantage). Over a projected 7-year LS hold period, the cumulative after-tax yield advantage versus IG corporate bonds compounds to approximately $173,600 of additional after-tax wealth generation on the $500K deployed capital.
Risk-adjusted considerations: The after-tax yield advantage must be weighed against structural differences between LS and ordinary-income alternatives. LS positions carry category-specific risks including longevity extension risk (insured outlives projected LE), carrier credit risk, policy contestability risk, and servicing risk. LS positions are illiquid with limited secondary market exit — Marcus must be comfortable with 5-10 year lockup horizon. IG corporate bonds and muni bonds offer higher liquidity but at the dramatic after-tax yield cost documented above. HY corporate bonds carry credit risk comparable to LS category risks but with daily liquidity through bond funds. REIT allocation offers real estate exposure diversification but with ordinary income tax drag. For Marcus's $500K incremental allocation from cash reserves (where liquidity need is low and after-tax yield priority is high), LS represents structurally superior after-tax outcome within acceptable risk framework.
Final allocation decision: Marcus deploys the $500K across 3-4 LS positions ($125K-$175K per position) with LE profiles ranging 7-10 years, diversifying longevity timing risk. His CPA (Garza & Partners) establishes position-level tax files per the Day 106 CPA checklist framework. Projected 7-year outcome: $500K deployed produces projected $900K+ in cumulative death benefits across the position portfolio, with CPA-coordinated Form 8949 reporting at each maturity producing LTCG classification. Marcus's existing muni bond ladder and private equity LP positions remain unchanged — the LS deployment specifically replaces cash reserves that were producing minimal after-tax yield (bank CDs at ~2.5% after-tax), redirecting the $500K to the structurally superior after-tax LS allocation. The decision aligns with Marcus's broader portfolio strategy of maximizing after-tax yield across illiquid-tolerant capital while preserving liquidity in muni + public equity allocations.
Marcus's deployment reflects the standard pattern for top-bracket investors reallocating from low-yielding cash reserves or ordinary-income positions into structurally tax-advantaged LS allocation. The framework: LS LTCG classification produces 7.62% after-tax yield at top bracket versus 2.66-4.44% from ordinary-income alternatives — a +71-186% after-tax advantage depending on comparison asset. The advantage compounds over multi-year hold periods and scales with portfolio size. Position-specific CPA coordination essential for state tax layering and bracket-specific projection accuracy.
Get matched with policies for after-tax yield replacement
Tell us your current income-focused allocation, federal bracket, and state of residence. We'll show you 2-3 vetted life settlement policies with projected after-tax yield comparison versus your current holdings and prepare documentation for your CPA review.
When ordinary-income alternatives still make sense — specific scenarios
The after-tax yield framework favors LS for most top-bracket investor scenarios, but ordinary-income alternatives retain specific use cases where their structural characteristics outweigh the after-tax yield disadvantage. Honest framework requires acknowledging where ordinary-income alternatives remain the correct allocation choice.
Four scenarios where ordinary-income alternatives remain correct allocation
1. Liquidity requirement overrides after-tax yield. For capital that must remain liquid for near-term use (operating cash flow, planned major purchase, emergency reserve), bank CDs, Treasury money market funds, and short-duration bond funds offer daily or near-daily liquidity that LS illiquidity cannot match. The after-tax yield disadvantage is accepted as the cost of liquidity preservation. Rule of thumb: 12-24 months of expenses should remain in liquid instruments regardless of after-tax yield analysis.
2. Low-bracket investor status. For investors below the 24% federal bracket (approximately below $200K income single or $400K married 2026), the LS after-tax yield advantage shrinks substantially because the ordinary income rate is lower (lower combined 27.8% total at 24% bracket vs 40.8% at 37% bracket). LS still offers advantage but the +150% magnitude at 24% bracket vs +186% at 37% bracket indicates the structural advantage scales with bracket. For truly low-bracket investors (12% or 22% federal), the LS complexity may not justify the smaller after-tax advantage.
3. High state tax jurisdictions where muni bonds dominate. For investors in California (13.3% top state), New York (10.9%), New Jersey (10.75%), or Hawaii (11%), municipal bonds issued by the investor's state of residence offer dual federal AND state tax exemption. The combined tax-equivalent yield can approach or exceed LS after-tax yield in these specific state scenarios. State-specific analysis essential — see our Life Settlement Tax by State 2026 piece for 4-tier state framework. Many high-bracket CA/NY investors maintain allocation to home-state munis specifically for this dual-exemption advantage alongside LS positions.
4. Portfolio diversification and asset class exposure requirements. Institutional-style portfolio construction typically prescribes allocation across multiple asset classes for diversification purposes — fixed income (bonds), equity (public + private), real estate (REITs + direct), alternatives (hedge funds + private credit + LS + etc.). Even if LS offers superior after-tax yield per unit allocated, prudent diversification requires maintaining meaningful allocation across other income-producing asset classes. The question is at the margin — for incremental allocation decisions beyond diversification baseline, LS structural advantage applies.
For top-bracket investors with existing diversified portfolios, the LS allocation decision is typically about incremental deployment (fresh capital, cash reserves rebalancing, or portfolio tilt adjustment) rather than complete reallocation. The after-tax yield framework provides decision support for marginal allocation decisions where tax drag matters most. Position-specific CPA + financial advisor coordination essential for allocation decisions involving substantial capital reallocation.
See currently available policies for top-bracket allocation
Every listing includes full policy documentation, LE reports from certified underwriters, AM Best carrier ratings, premium projections, projected IRR, and bracket-specific after-tax yield projection documentation. Accredited investor verification per SEC Rule 501 required to view specific policies.
Or call (833) 250-9677Frequently asked questions about LS vs ordinary income after-tax
How do municipal bonds compare to life settlements for top-bracket investors?
Municipal bonds offer federal tax exemption (and state tax exemption for home-state munis) that eliminates most of the tax drag on their nominal yields — making them the strongest ordinary-income competitor to LS positions for top-bracket investors. At 2026 nominal yields of approximately 3.6% for investment-grade munis, the after-tax yield equals the nominal yield (federal-exempt) = 3.60% after-tax. For LS LTCG at 7.62% after-tax, the after-tax yield gap is approximately 4 percentage points — a +112% LS advantage versus IG munis. For high-yield munis at 3.65-3.74% nominal (approximately 3.70% after-tax), the LS advantage is approximately 4 percentage points = +106%. However, munis offer substantially different structural characteristics than LS: munis provide daily liquidity through bond funds or secondary market trading, carry no longevity-related risks, and have transparent credit quality through established rating infrastructure. For investors in high state tax jurisdictions (California, New York, New Jersey, Hawaii) buying home-state munis for dual federal + state exemption, the after-tax yield competitiveness improves further — a California resident buying California muni bonds effectively gets 3.6% nominal + 0% federal tax + 0% CA state tax = 3.60% after-tax with no state exposure. For high-bracket investors in high state tax jurisdictions, home-state munis often represent the complement to LS allocation rather than competitor — munis provide liquid tax-advantaged allocation while LS provides illiquid tax-advantaged allocation with higher after-tax yield at the cost of lockup period. Position-specific allocation analysis essential for investor-specific optimization.
How does the REIT 20% QBI deduction affect ordinary REIT dividend after-tax yield?
Under IRC §199A(a) added by TCJA 2017, qualified REIT ordinary dividends qualify for a 20% qualified business income (QBI) deduction, reducing the effective federal rate on these dividends from the full ordinary rate structure. For a top-bracket investor at 37% ordinary + 3.8% NIIT, the §199A QBI deduction reduces the effective federal rate on qualified REIT dividends from 40.8% to approximately 32.8% (37% × 0.80 + 3.8% = 32.8%). This improvement in effective rate explains why REIT ordinary dividends at 5.5% nominal yield produce approximately 3.70% after-tax yield rather than the 3.26% that would result from applying the full 40.8% rate ($5.50 × (1 - 0.408) = $3.26). The QBI deduction improves REIT after-tax yield competitiveness but does not reach LS LTCG levels — LS at 10% nominal with 23.8% rate produces 7.62% after-tax versus REIT 5.5% nominal with 32.8% effective rate producing 3.70%. The LS advantage is approximately +106% after-tax yield advantage versus REIT ordinary dividends at top bracket. The §199A QBI deduction was initially scheduled to sunset after 2025 under TCJA but was extended by the One Big Beautiful Bill Act (OBBBA) in July 2025 — current treatment applies through 2026 and beyond pending future Congressional action. REIT investors should coordinate with CPA for position-specific QBI calculation and documentation requirements. Note that REIT capital gain distributions receive separate LTCG treatment at 23.8% federal max (same rate structure as LS LTCG), but the typical REIT distribution mix is heavily weighted toward ordinary dividends with smaller capital gain distribution component.
How does state tax layering change the LS vs ordinary income comparison?
State tax dramatically affects the after-tax yield comparison in jurisdictions with meaningful state capital gains and ordinary income rates. For zero-tax states (AK, FL, MO, NV, NH, SD, TN, TX, WY per our Day 102 state tax framework), the federal-only analysis in this piece applies directly — LS at 7.62% after-tax vs IG corp at 2.66% at top bracket. For high-tax states (CA 13.3%, NY 10.9%, NJ 10.75%, HI 11% approximate top rates for ordinary; CA/NY/NJ typically apply same rate to LTCG), both LS LTCG and IG corp ordinary face additional state tax drag, but the proportions differ. For California top bracket (37% federal + 13.3% state = 50.3% ordinary; 20% LTCG + 3.8% NIIT + 13.3% state = 37.1% LTCG): LS at 10% × (1-0.371) = 6.29% after-tax vs IG corp at 4.5% × (1-0.503) = 2.24% after-tax = +181% LS advantage even after California state tax drag. The LS advantage is slightly smaller in high-tax states compared to zero-tax states, but still substantial. For municipal bonds in home-state jurisdictions, the dual exemption (federal + state) provides advantage versus LS in state tax calculation but LS still typically wins on absolute after-tax yield. Position-specific state tax calculation essential — see our Life Settlement Tax by State 2026 piece for comprehensive state framework. For investors contemplating state residency changes to optimize LS deployment timing, the 2+ year safe harbor framework in that piece applies.
Why does the LS advantage percentage change at the 32% to 35% bracket transition?
The LS advantage percentage shifts between the 32% and 35% federal brackets because the LTCG rate structure increases at the 35%+ bracket while the ordinary rate structure continues incremental progression. At the 24% and 32% federal brackets, LTCG rate is 15% + 3.8% NIIT = 18.8% combined. At the 35% and 37% federal brackets, LTCG rate increases to 20% + 3.8% NIIT = 23.8% combined — the LTCG rate jumps 5 percentage points between the 32% and 35% transition points. Ordinary rate progression: 24% + 3.8% = 27.8% at 24% bracket; 32% + 3.8% = 35.8% at 32% bracket; 35% + 3.8% = 38.8% at 35% bracket; 37% + 3.8% = 40.8% at 37% bracket. The LTCG rate jump at the 35% bracket slightly compresses the LS advantage versus the 32% bracket. Specifically: at 24% bracket, LS 8.12% vs IG corp 3.25% = +150% advantage; at 32% bracket, LS 8.12% vs IG corp 2.89% = +181% advantage; at 35% bracket, LS 7.62% vs IG corp 2.76% = +176% advantage (LS yield dropped from 8.12% to 7.62% at the LTCG rate transition); at 37% bracket, LS 7.62% vs IG corp 2.66% = +186% advantage. The non-monotonic pattern (advantage grows from 24% to 32%, slightly declines at 35%, then grows again at 37%) reflects the structural tax rate transition at the 35% bracket LTCG threshold. For most practical allocation purposes, the LS advantage is substantial (+150% minimum, +186% maximum) across the entire 24-37% federal bracket range targeted by HYV accredited investors. Position-specific bracket analysis essential for marginal allocation decisions near bracket transition points.
Does the LS after-tax advantage apply to short-term holdings or only long-term?
The LS after-tax yield advantage described in this piece applies specifically to long-term holdings — LS positions held more than 1 year, qualifying for long-term capital gain treatment at the preferential 23.8% federal maximum rate under IRC §1(h). Short-term LS holdings (held 1 year or less) would receive short-term capital gain treatment at ordinary income rates — same as ordinary income alternatives in this comparison, eliminating the structural tax advantage. In practice, LS positions are inherently long-term holdings: typical LS LE profiles range 5-10 years from acquisition to maturity, and even secondary market exits within the first year would be highly unusual given the illiquidity structure and the typical LS investor strategic rationale. The LTCG classification applies at maturity (death benefit received more than 1 year after acquisition) regardless of insured longevity timing — even if the insured passes 18 months after acquisition, the LTCG treatment applies because the investor held the position more than 1 year. The reportable policy sale framework per IRC §101(a)(3) does not alter the LTCG classification for appropriately-structured positions — see our Day 103 TFV rule piece for complete framework. The practical consideration: investors should structure LS acquisitions with the expectation of multi-year hold periods consistent with LE profiles. Short-term exit scenarios (sell within 1 year to secondary market) would face short-term capital gain treatment at ordinary rates, eliminating the structural advantage. This is one additional reason the LS allocation suits capital that can commit to the longer-term lockup — the tax structure rewards patience.
What portfolio allocation framework works best for integrating LS with existing income holdings?
For top-bracket investors with diversified portfolios including existing fixed income, REIT, and other income allocations, LS integration typically follows a complementary allocation framework rather than wholesale replacement. The framework: (1) maintain liquid income allocation (muni bonds, Treasury money market, short-duration IG bonds) at approximately 12-24 months of expenses as liquidity reserve regardless of after-tax yield analysis; (2) maintain diversification across major income asset classes (bonds, REITs, private credit) at prudent allocation levels for portfolio construction purposes; (3) deploy incremental capital or rebalance underperforming allocations into LS positions where the after-tax yield advantage is most pronounced; (4) coordinate LS allocation sizing with risk tolerance and illiquidity capacity. Typical LS allocation for top-bracket accredited investors ranges 5-20% of total portfolio depending on investor liquidity profile and risk tolerance — not 100% replacement of other income holdings. The LS structural tax advantage justifies tilting incremental allocation toward LS at the margin, but prudent diversification argues against concentrated LS allocation. For investors reallocating from cash reserves specifically (as in Marcus's example above), the LS deployment represents conversion of low-yielding liquid capital into higher-yielding illiquid capital with substantial after-tax advantage — a specific use case where LS fits well. Position-specific financial advisor + CPA coordination essential for allocation sizing and portfolio integration decisions. HYV position consultations include portfolio integration analysis to coordinate with client's broader allocation framework.
Start with the 5-asset comparison framework
Two paths to begin: browse currently available life settlement policies to see what matches your top-bracket after-tax yield replacement needs, or schedule a consultation to walk through the 5-asset framework applied to your specific portfolio allocation and tax situation.
Or call (833) 250-9677