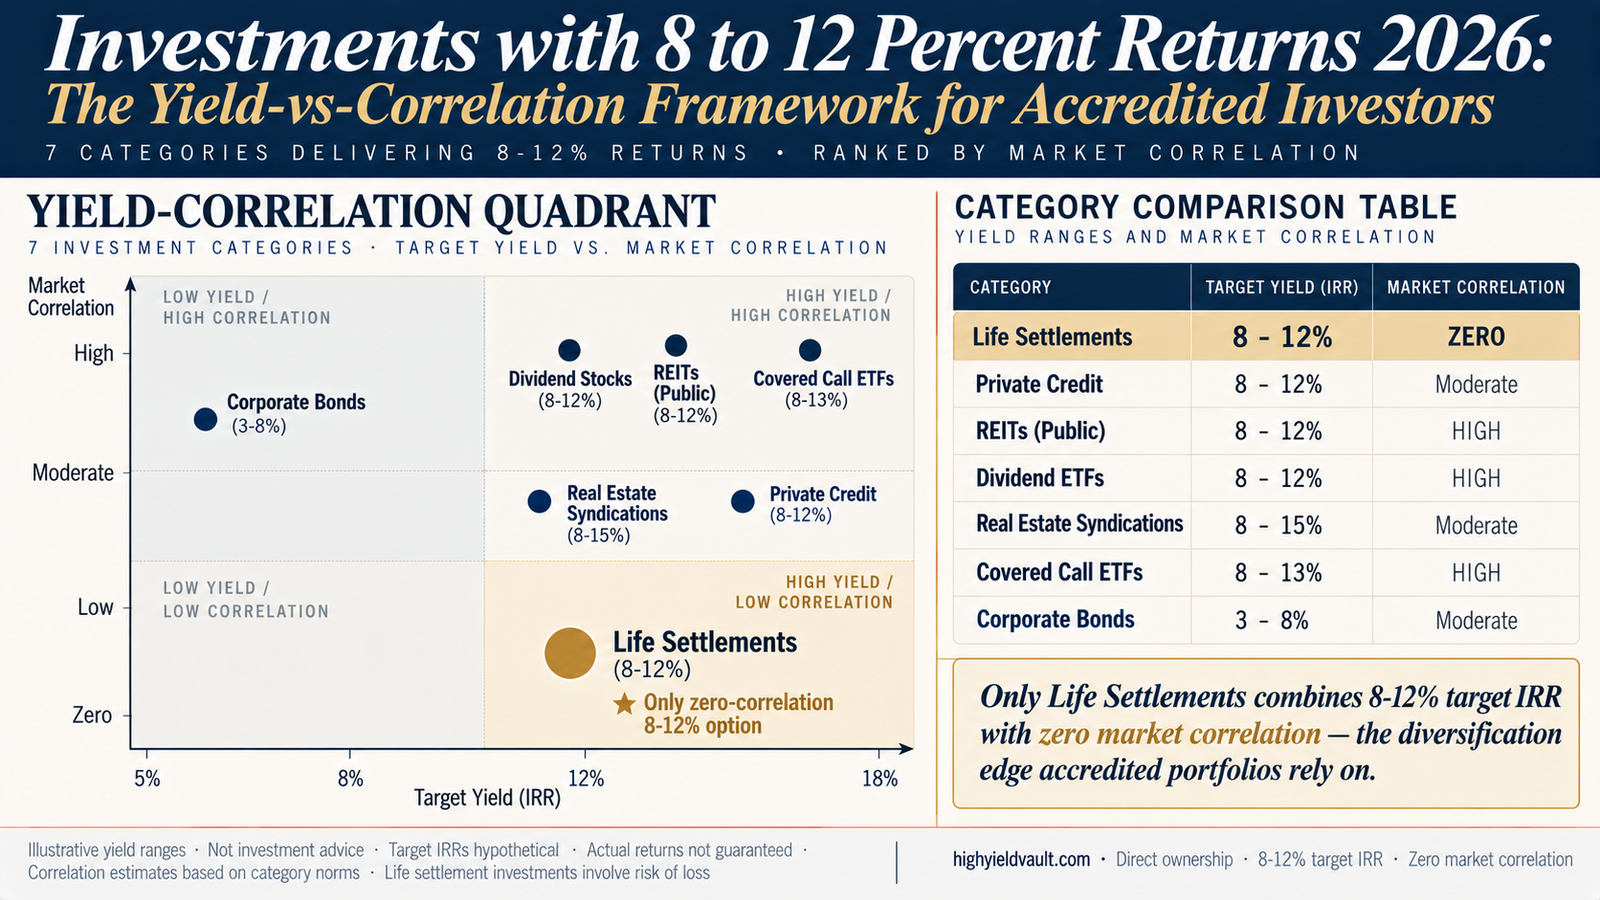
Seven investment categories target the 8-12% return tier in 2026: private credit (8-12% yield, moderate correlation), public REITs (8-12%, high correlation), dividend ETFs (8-12%, high correlation), real estate syndications (8-15% IRR, moderate correlation), covered call ETFs (8-13%, high correlation), corporate bonds (mostly 3-8%, moderate correlation), and life settlements (8-12% target IRR, zero market correlation).
Life settlements are the only category in the 8-12% target tier that delivers this yield with zero correlation to equity or bond markets. The 6 other options all move with — or against — public market cycles in some form, which materially reduces the diversification benefit they add to an accredited portfolio. All target IRRs illustrative and not guaranteed. Life settlement investments involve substantial risk including loss of capital and are available only to accredited investors per SEC Rule 501.
Browse life settlement policies in the 8-12% target IRR range
Every listing shows full policy documentation, LE reports, AM Best carrier ratings, premium schedules, and projected IRR — so you can evaluate the winning yield-correlation quadrant firsthand rather than in the abstract.
Browse available policiesWhy 8-12% is the accredited investor sweet spot
The 8-12% target yield range is the sweet spot for accredited investor allocations because it captures the risk-adjusted returns most investors actually need without the concentrated risk of the higher-yield categories (private equity 15-25%+ net IRR, venture capital 20%+ potential) or the yield compression of traditional bond-heavy portfolios (investment-grade bonds 5-6% annualized). At 8-12%, an accredited investor beats inflation by a meaningful margin, exceeds the S&P 500's long-term 10% historical average when positioned at the top of the range, and does so through categories that structurally distribute or contractually deliver returns rather than depend on speculative appreciation.
What matters at this yield tier is not just whether a category delivers 8-12%, but how it delivers it. Two 10% yield categories can add radically different value to a portfolio depending on their correlation profile. A 10% return correlated to public markets adds duplicative exposure — it moves with the rest of the portfolio and offers minimal diversification benefit. A 10% return that is genuinely uncorrelated adds structural value: it earns during periods when the correlated portfolio underperforms, smoothing the aggregate return path. This is why sophisticated accredited investors evaluate 8-12% opportunities on yield-per-correlation basis, not just headline yield.
Global private markets now represent over $30 trillion in assets under management, driven largely by accredited and institutional demand for exactly this profile: predictable 8-12% target returns with genuine diversification value. The comparison matrix below ranks the 7 categories on both dimensions — target yield and market correlation — so accredited investors can see clearly which categories deliver diversification alongside yield versus which duplicate exposure already present in a traditional portfolio.
The 7 categories delivering 8-12% target returns
Below is a side-by-side comparison of the 7 investment categories that consistently target the 8-12% yield range in 2026, drawn from consensus data across StockAnalysis, BAM Capital, Sage Investment Group, and other institutional-tier sources. The comparison ranks each on market correlation, liquidity, minimum investment tier, and best-fit investor profile.
Only life settlements combine 8-12% target IRR with zero market correlation — the diversification edge accredited portfolios genuinely rely on.
Yield ranges reflect consensus 2026 data from institutional-tier sources. Correlation estimates are approximate and vary by market conditions and specific sub-category positioning. Target IRRs and yields are hypothetical and not guaranteed. Individual investor returns vary substantially based on specific selection, timing, and market conditions.
Not sure how life settlements fit your existing 8-12% allocation?
Schedule a 20-minute consultation. We'll walk through your current 8-12% target exposures (dividend ETFs, REITs, private credit, syndications) and show where LS adds genuine diversification versus where you already have overlapping correlation.
Or call (833) 250-9677The yield-correlation quadrant: where each category lives
The comparison table shows the categories individually. The quadrant visualization below plots them together on two dimensions — target yield (horizontal axis) and market correlation (vertical axis) — so the winning quadrant becomes visible at a glance. The bottom-right quadrant (high yield, low-to-zero correlation) is what accredited portfolios structurally lack from traditional allocations. Only one category among the seven lives there.
high correlation
high correlation
low correlation
low correlation
(winning quadrant)
Reading the quadrant: five of the six alternatives to life settlements cluster in the top-right zone — high yield but high correlation to public markets. Private credit and real estate syndications sit in the middle (moderate correlation). Life settlements alone occupy the bottom-right winning quadrant — the target 8-12% IRR delivered without any structural link to equity or bond market cycles. This is what makes LS the true diversification anchor rather than another yield sleeve.
Real walkthrough: Diane's 8-12% yield portfolio construction
Here's how the yield-correlation framework applies in practice, illustrated through a composite investor scenario based on the standard pattern for accredited investors building a dedicated 8-12% target sleeve.
Accredited investor · $800K deployment across 4 categories in the 8-12% tier
Starting position: Diane, a 58-year-old physician with $2.6M investable, wants to build a dedicated $800K sleeve targeting 8-12% returns as the "yield engine" of her overall portfolio. Her existing $1.8M sits mostly in a traditional 60/40 stock-bond allocation. Her goal: add genuine diversification (not just more of the same market exposure) while raising blended yield above the 5-6% her traditional bonds now deliver.
Category selection process: Diane's advisor walks her through the 7-category framework. She eliminates covered call ETFs (high correlation, capped upside inconsistent with her long-hold preference) and corporate bonds (below her yield target). She narrows to the 5 categories that both target 8-12% and offer diversification beyond her existing 60/40 exposure.
Allocation 01 — Life Settlements ($300K, 37.5%): Diane deploys the largest sleeve into 2-3 direct-ownership life settlement policies with staggered LE maturities. Selected specifically because it's the ONLY 8-12% option with zero market correlation — the diversification anchor her existing 60/40 portfolio structurally lacks. Projected blended IRR: 10.2%.
Allocation 02 — Private Credit ($200K, 25%): Diversified private credit fund with secured lending across real estate sponsors and middle-market businesses. Monthly interest payments at 8.5% annualized yield, 3-year commitment. Moderate correlation acceptable given the different underlying credit risk drivers vs her existing equity/bond exposure.
Allocation 03 — Real Estate Syndications ($200K, 25%): Two multifamily syndications ($100K each) in Sun Belt markets. Quarterly cash-on-cash distributions of 6-7% plus back-end appreciation targeting 10% blended IRR. Depreciation shielding materially improves after-tax return vs same-yield taxable alternatives.
Allocation 04 — Dividend ETF Sleeve ($100K, 12.5%): High-quality dividend ETFs targeting 5-6% yield with growth potential. Small allocation acknowledged as high correlation — kept in for liquidity buffer and dividend cash flow, not diversification value.
Projected blended sleeve yield: LS 10.2% ($300K) + Private Credit 8.5% ($200K) + RE Syndications 10% ($200K) + Dividend 5.5% ($100K) = blended sleeve target 9.1% annualized, with the diversification anchor (LS) providing the structural feature the other three cannot: return path uncorrelated to her existing 60/40 exposure.
Diane's $800K yield-sleeve reflects the standard pattern for accredited investors constructing a dedicated 8-12% target allocation. The LS cornerstone (37.5%) provides the diversification value her existing portfolio structurally lacks; private credit and RE syndications provide monthly and quarterly cash flow with different underlying risk drivers than her equity/bond core; and the small dividend ETF sleeve is included for liquidity and cash flow rather than diversification benefit. The framework: use the 8-12% tier to buy diversification you don't already have, not more of the market exposure you already own.
Get matched with policies fitting your 8-12% target
Tell us your target hold period, existing 8-12% exposures, and IRR preference. We'll show you 2-3 vetted life settlement policies matched to your specific diversification objectives — before you commit anything.
Why direct ownership matters at the 8-12% tier
Most life settlement access at the 8-12% target tier flows through pooled fund vehicles charging 2-and-20 fee structures. Over a 7-10 year hold, this fee drag consumes 30-40% of gross IRR — enough to compress a 10% gross target into a 6-7% net return. At that compression level, the diversification advantage of LS shrinks relative to correlated 8-12% alternatives that come without the fee drag (public REITs, dividend ETFs). HYV operates the opposite model: direct ownership of individually-vetted policies with your name on carrier records as owner and beneficiary. Gross target IRR flows directly to the investor without fund manager compression.
The direct-ownership model is the same institutional approach deployed by Apollo Global Management, Berkshire Hathaway, and Partner Re — accessible for accredited individuals at $250K per policy tickets through HYV. Direct ownership is what preserves the 8-12% target IRR at the investor level while maintaining the zero-correlation profile that puts LS in the winning quadrant.
See currently available policies in the 8-12% target tier
Every listing includes full policy documentation, LE reports from certified underwriters, AM Best carrier ratings, premium projections, and projected IRR. Accredited investor verification per SEC Rule 501 required to view specific policies.
Or call (833) 250-9677Frequently asked questions about 8-12% return investments
What are the safest investments with 8 to 12 percent returns?
"Safety" is a nuanced concept in the 8-12% return tier — no category is truly risk-free at this yield level (categories that appear safer typically deliver 3-6% instead). Among the 7 categories targeting 8-12%, the risk profiles differ meaningfully by category: private credit is generally lower volatility with backing from underlying secured loan collateral; life settlements involve longevity extension risk and carrier credit risk but ZERO market correlation (protecting against equity/bond drawdowns); real estate syndications carry property-specific and market-cycle risk; public REITs and dividend ETFs move with equity markets; covered call ETFs cap upside. For most accredited investors, "safety" at 8-12% comes from diversification across multiple categories rather than concentration in any single "safest" option. The framework: use the 8-12% tier to buy diversification you don't already have, not more of the market exposure you already own. All alternative investments involve substantial risk including loss of capital.
Can I really get 8-12% returns without high market risk?
Yes — but only through a specific subset of the 8-12% category tier. High market risk specifically refers to correlation with equity/bond public markets. Categories that deliver 8-12% with LOW-to-ZERO market risk exposure exist but are limited: life settlements (zero market correlation, 8-12% target IRR at maturity), private credit (moderate correlation via underlying borrower credit conditions), and to some extent real estate syndications (moderate correlation via property market cycles). Categories that deliver 8-12% with HIGH market correlation include public REITs, dividend ETFs, and covered call ETFs — these move with public markets even when the yield component looks steady. The distinction matters: a portfolio holding 20% dividend ETFs already has meaningful equity market exposure and adds minimal diversification benefit from more equity-correlated 8-12% categories. Life settlements provide the structural zero-correlation profile that no other 8-12% category delivers.
How do life settlements deliver 8-12% target IRR?
Life settlements deliver 8-12% target IRR through a specific structural mechanism: the accredited investor acquires an existing life insurance policy at a discount to its future death benefit, then continues paying premiums until policy maturity, at which point the investor receives the full death benefit. The IRR is the mathematical function of (acquisition price + premiums paid) vs (death benefit received) over the actual holding period (LE-driven, typically 5-10 years). Returns are contractually specified by the insurance policy — not dependent on public market performance, interest rate movements, or economic cycles. The 8-12% target range reflects the mathematical outcome when policies are acquired at institutional pricing and held to LE. Actual IRR varies based on longevity extension (insured lives longer than LE, extending premium payments), carrier credit performance, and policy-specific factors. For a complete deep-dive on LS returns mechanics, see our Life Settlement Investment Returns 2026 guide.
Should I choose private credit or life settlements at the 8-12% tier?
Not either/or — most accredited investors deploy across both, because they play different roles despite occupying the same target yield tier. Private credit delivers 8-12% through monthly/quarterly interest payments during the hold period (income-first with moderate market correlation via borrower conditions). Life settlements deliver 8-12% through contractual return at policy maturity (5-10 years) with zero market correlation. The typical accredited allocation includes both: private credit for interim cash flow, LS for the diversification anchor and larger back-end maturity payments. In a $500K yield sleeve, common allocation is $250-300K to LS (cornerstone) + $150-200K to private credit (income producer) + smaller sleeves in other 8-12% categories. Neither is "better" — they solve different portfolio needs at the same yield tier.
Are 8-12% returns realistic in 2026 or too good to be true?
8-12% target returns are realistic for accredited investors in 2026 across multiple institutional-tier categories — but the returns come with specific structural trade-offs that non-accredited investors typically cannot access. The trade-offs include: illiquidity (multi-year lockups for LS, private credit, real estate syndications, PE), complexity (evaluating individual policies, syndication sponsors, credit fund managers), minimum capital requirements ($100K-$250K per position), and category-specific risks (longevity for LS, property cycles for RE, borrower default for credit). The 8-12% yield tier is NOT unrealistic — it reflects the illiquidity premium plus complexity premium that accredited investors receive for accepting these constraints. What IS unrealistic: claims of 8-12% returns with daily liquidity, no minimums, and zero risk — these typically indicate either (a) return manipulation, (b) hidden risk exposure, or (c) unsustainable yield strategies. Legitimate 8-12% target categories all involve one or more of the structural constraints above.
How much of my portfolio should target 8-12% returns?
The appropriate allocation to 8-12% target categories varies by investor circumstances but typically falls in the 30-50% range of an accredited investor's total investable portfolio. Investors already heavily positioned in public equities (60/40 or higher stock allocation) benefit most from adding 8-12% categories that are UNCORRELATED to their existing exposure — meaning LS and private credit rather than more REITs or dividend ETFs. Investors with meaningful bond-heavy positions benefit from adding higher-yielding uncorrelated alternatives to replace some of the yield-compressed bond exposure. The specific allocation percentages depend on liquidity requirements, income needs, existing tax situation, and total investable capital. Our $500K deployment guide (how to invest $500K) and $1M deployment guide (how to invest $1 million dollars) provide specific allocation frameworks for accredited investors deploying at those capital tiers.
Start with the winning quadrant anchor
Two paths to begin: browse currently available life settlement policies to see the winning quadrant firsthand, or schedule a consultation to walk through the 7-category framework applied to your specific existing 8-12% allocation.
Or call (833) 250-9677