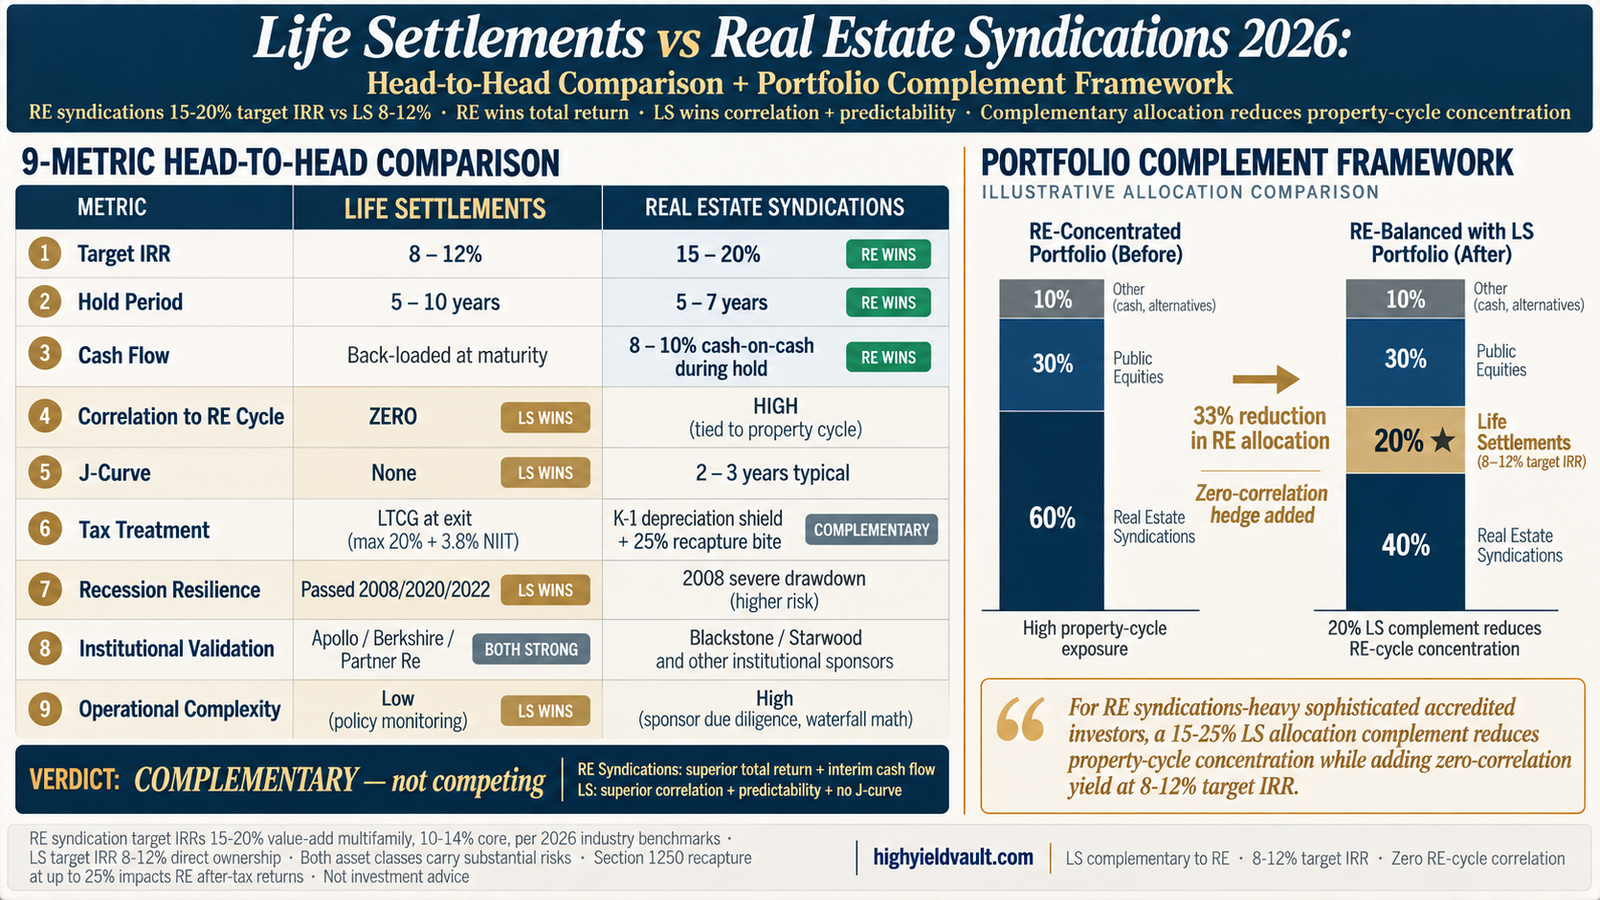
Real estate syndications and life settlements are complementary rather than competing asset classes for sophisticated accredited investors. RE syndications are superior for total return (15-20% target IRR value-add multifamily, 10-14% core per 2026 industry benchmarks), interim cash flow (8-10% cash-on-cash during 5-7 year holds), and tax-advantaged structure (K-1 depreciation shield, cost segregation acceleration in years 1-5). Life settlements target lower absolute returns (8-12% direct ownership) but win on correlation characteristics: zero correlation to the real estate cycle (confirmed through 2008 global financial crisis, 2020 COVID crisis, and 2022 rate/CRE cycle shift), no J-curve (returns delivered at policy maturity rather than requiring 2-3 year capital call ramp), and recession-independent return mechanics (payouts triggered by natural insured mortality, not property NOI or cap rate dynamics).
For RE syndications-heavy sophisticated accredited investors (typically those with 40-70% of alternatives sleeve in RE positions), a 15-25% LS allocation complement meaningfully reduces property-cycle concentration while adding yield at 8-12% target IRR — the LS cornerstone functions as portfolio-level cycle hedge rather than yield substitute. The framework honestly acknowledges that RE syndications remain the superior single-position choice for total return and interim distribution; LS adds different value through correlation diversification. All returns illustrative; not guaranteed. Life settlement investments involve substantial risk including loss of capital and are available only to accredited investors per SEC Rule 501.
Browse life settlement policies for RE diversification
Every listing includes LE reports, AM Best carrier ratings, premium schedules, and projected IRR — the data needed to evaluate LS as a cycle-independent complement to existing RE syndication positions.
Browse available policiesWhy RE-heavy investors need cycle-independent diversification
Real estate syndications are powerful wealth-building vehicles. The structure — pooling accredited investor capital to acquire institutional-scale properties with professional operator management — produces target IRRs (15-20% value-add multifamily, 10-14% core/stabilized) that compare favorably against most alternatives on a total-return basis. The 8-10% cash-on-cash distributions during 5-7 year holds generate meaningful interim income. K-1 depreciation flows through to shield significant portions of distributed cash from current taxation. For sophisticated accredited investors building wealth through alternatives, RE syndications are often (correctly) the largest category allocation.
The structural weakness that affects RE-heavy portfolios isn't inherent to RE syndications themselves — it's concentration. When an investor's alternatives sleeve is 40-70% real estate across multiple syndications, those positions share fundamental exposure to the commercial real estate cycle. Interest rates affect them simultaneously (rising rates compress cap rates, suppressing exit valuations across the portfolio). Credit conditions affect them simultaneously (debt availability determines whether planned refinances execute). Property-type-specific dynamics affect clustered positions simultaneously (multifamily-heavy portfolios respond together to rent growth softening; office-heavy portfolios responded together to post-2020 occupancy declines). The 2022 commercial real estate downturn — triggered by Fed rate hikes and compressed cap rates — produced simultaneous mark-to-market stress across the entire sector, affecting syndications regardless of specific sponsor quality or property-level fundamentals.
For RE-concentrated accredited investors, the diversification question is not "is RE a good asset class?" (it generally is) but "what reduces property-cycle concentration without sacrificing yield characteristics?" The traditional answers — public equities, bonds, cash — reduce yield substantially (bonds and cash in low-rate environments produce 2-5%, well below RE target returns; equities carry their own market-cycle correlation). Life settlements specifically occupy an unusual position: yield of 8-12% that remains competitive with the lower end of RE syndication returns (core/stabilized 10-14% target), combined with zero correlation to the RE cycle because the return mechanism is insured mortality rather than property NOI, cap rates, or credit conditions. The LS cornerstone functions differently from other alternatives in a RE-heavy portfolio — not substituting for RE's upside but adding yield that persists when RE cycles weaken.
The 9-metric head-to-head comparison
The matrix below compares LS and RE syndications honestly across 9 structural metrics. Rows are color-coded to show which asset class offers the superior metric: gold-highlighted for LS advantage, neutral-highlighted for RE advantage, dashed for complementary (both have value in different roles). The final verdict row acknowledges the honest tradeoff: RE wins total return and interim cash flow; LS wins correlation, predictability, and recession resilience.
RE syndications win total return and interim cash flow. LS wins correlation, predictability, and recession resilience. Framework position: complementary allocation, not competing substitute.
RE syndication target IRRs reflect 2026 industry benchmarks for professionally managed accredited offerings: value-add multifamily 15-20% target total IRR per BiggerPockets consensus and syndication industry data; core/stabilized 10-14%; cash-on-cash 8-10% during hold periods. Actual sponsor-specific returns vary substantially based on sponsor execution, market cycle timing, vintage year, debt structure, and property-level performance. Section 1250 depreciation recapture at exit can reach 25% federal rate, erodes after-tax returns substantially — this nuance is often underreported in sponsor underwriting per Angel Investors Network research. RE syndication risks include property-cycle risk, interest rate sensitivity, cap rate expansion risk, sponsor execution risk, debt refinance risk (particularly for value-add positions with planned refinances), market-specific risks (asset class concentration, geographic concentration), K-1 complexity (multi-state tax filing for interstate deals), and limited secondary market liquidity. LS target IRRs reflect direct-ownership deployment at 8-12% range; actual investor returns vary substantially based on policy selection, longevity outcomes against LE estimates, carrier credit, premium management, and other factors. LS risks include longevity extension risk, carrier credit risk, contestability risk, servicing risk, and limited secondary market liquidity. Correlation characterization reflects observed cross-cycle performance; past correlation does not guarantee future correlation. Named institutional allocators (Apollo Global Management, Berkshire Hathaway, Partner Re, Blackstone, Starwood Capital, Brookfield) are referenced based on publicly-documented asset management activities and do not imply endorsement or affiliation with High Yield Vault.
How much LS complements your existing RE syndication sleeve?
Schedule a 20-minute consultation. We'll walk through your current RE position concentration, measure cycle-correlation exposure, and show where LS can add cycle-independent yield at direct-ownership $200K+ ticket sizes.
Or call (833) 250-9677The portfolio complement framework: before and after LS
The visualization below shows how a representative RE-concentrated portfolio composition changes with LS complement addition. The "before" bar shows a typical RE-heavy accredited portfolio composition. The "after" bar reduces the RE allocation by one-third (from 60% to 40%) and redirects to a 20% LS cornerstone complement. The result: meaningful property-cycle concentration reduction while preserving total alternatives weighting at 60%.
Allocation framework illustrative · Specific complement percentage (15-25% LS typical range) depends on starting RE concentration, liquidity needs, risk tolerance, and existing alternatives sleeve composition
For RE syndications-heavy sophisticated accredited investors, a 15-25% LS allocation complement reduces property-cycle concentration while preserving total alternatives weighting through cycle-independent yield at 8-12% target IRR.
Real walkthrough: Thomas's RE syndications-heavy diversification into LS
Here's how the RE-complement framework applies in practice, illustrated through a composite scenario based on the standard pattern for sophisticated RE-heavy accredited investors adding LS allocation.
RE syndications-heavy accredited investor · $2.8M portfolio adding $600K LS complement
Starting position: Thomas, a 62-year-old retired commercial real estate attorney with $2.8M investable, built his alternatives exposure during his career through direct knowledge of the RE syndications space. His portfolio composition: $1.68M (60%) across 8 RE syndications (4 multifamily value-add, 2 industrial core, 1 retail power center, 1 self-storage), $840K (30%) in diversified public equities, $280K (10%) across cash and short bonds. Alternatives sleeve is essentially 100% real estate — concentrated by design based on his domain expertise.
The concentration realization: The 2022 commercial real estate downturn produced simultaneous mark-to-market stress across Thomas's RE positions as cap rate expansion compressed exit valuations and refinance assumptions shifted unfavorably. Three of his 8 syndications extended projected hold periods by 18-36 months; two reduced distribution projections. Despite the fact that his sponsors remained strong and property-level fundamentals held, the sector-wide stress revealed that his "diversified RE portfolio" was actually heavily exposed to a single macroeconomic variable (cap rate dynamics driven by Fed policy). His conclusion: he needs cycle-independent complement without exiting positions he still believes in long-term.
Framework-based allocation shift: Thomas applies the LS portfolio complement framework. He targets reducing his RE allocation from 60% to 40% (freeing approximately $560K) and adding a $600K LS cornerstone (21% of portfolio) by also redirecting approximately $40K from his cash reserves. His revised target composition: $1.12M (40%) RE syndications across 5 consolidated positions, $600K (21%) LS 3-policy LE ladder cornerstone, $840K (30%) public equities, $240K (9%) cash. Total alternatives sleeve rises slightly (60% → 61%) but composition shifts meaningfully.
LS cornerstone deployment: Thomas deploys the $600K across 3 direct-ownership life settlement policies with staggered LEs at 5.8 / 7.4 / 9.1 years, blended target IRR 10.4%. Policy selection emphasizes mortality curve diversification (different age cohorts, different underlying health profiles) and carrier diversification (3 different A-rated issuing insurers). The staggered structure delivers portfolio-level maturity timing diversification impossible with single-position deployment.
Projected outcome: Thomas's new portfolio generates approximately $168K annual pre-tax income blended across RE syndication cash-on-cash (reduced from previous $118K with concentration maintained), LS back-loaded return accrual (accrues to policy maturities), equity dividends, and short bonds. More importantly, the correlation structure fundamentally shifts: a hypothetical RE-cycle stress event similar to 2022 now affects only 40% of the portfolio directly (vs 60% previously), with the 21% LS cornerstone and 30% equities providing meaningful offset. Property-cycle concentration risk reduced by approximately 33% while adding yield at 8-12% target IRR on the new sleeve. Thomas retains his domain expertise in RE while adding cycle-independent complement specifically designed to reduce the single-sector vulnerability his 2022 experience revealed.
Thomas's reallocation reflects the standard pattern for RE-sophisticated accredited investors adding LS complement after experiencing cycle-concentration stress. The framework: a 15-25% LS allocation can be sourced partially from RE reduction and partially from other liquid allocations to add cycle-independent yield without abandoning RE exposure. The investor who built RE expertise over a career can preserve meaningful RE allocation while reducing the single-sector concentration vulnerability that cycle-stress events reveal.
Get matched with policies for your LS cornerstone complement
Tell us your current RE syndication exposure, target complement percentage, and existing portfolio composition. We'll show you 2-3 vetted life settlement policies specifically matched to anchor the cycle-independent complement to your existing RE allocation.
Why direct ownership preserves the complement value proposition
The LS complement value proposition — 8-12% target IRR with zero correlation to the RE cycle — only holds when the investor acquires direct ownership of individual policies rather than pooled fund wrappers. In pooled LS fund vehicles with typical 2-and-20 fee structures, fee drag over 7-10 year holds consumes 30-40% of gross IRR — compressing LS category yield from 8-12% target to 5-7% net at the investor level. At that compression, the LS complement provides reduced correlation but at a yield level that no longer competes with the lower end of RE syndication returns (core/stabilized 10-14%). The complement framework specifically relies on direct-ownership target IRR preservation for the yield-and-correlation combined value proposition.
Direct ownership is the structural approach that preserves both target IRR and correlation characteristics at the investor level. The investor acquires beneficial ownership of individual policies rather than fund units — receiving the full death benefit payout at policy maturity rather than fund NAV calculations net of manager fees. This is the same institutional approach deployed by Apollo Global Management, Berkshire Hathaway, and Partner Re at scale — accessible for accredited individuals at $200K per policy tickets through HYV. For RE syndications-heavy investors building the complement cornerstone, direct ownership preserves the 8-12% target IRR that makes LS competitive as a yield-and-correlation sleeve rather than correlation-only sleeve.
See currently available policies for complement deployment
Every listing includes full policy documentation, LE reports from certified underwriters, AM Best carrier ratings, premium projections, and projected IRR. Accredited investor verification per SEC Rule 501 required to view specific policies.
Or call (833) 250-9677Frequently asked questions about LS vs RE syndications
Should I replace my RE syndications with life settlements?
Generally no — the framework position is complementary, not substitutive. RE syndications remain superior for several structural reasons that LS cannot match: higher total return potential (15-20% target IRR for value-add multifamily vs 8-12% LS), interim cash flow during hold (8-10% cash-on-cash vs LS back-loaded at maturity), K-1 depreciation shield that provides tax-advantaged distribution structure, inflation hedge characteristics through rent growth, and institutional-scale property ownership exposure that LS cannot replicate. If RE syndications fit your investment thesis, holding period preferences, and tax situation, they should likely remain a meaningful allocation. The LS value proposition is specifically about reducing property-cycle concentration for investors whose alternatives sleeve has become RE-heavy (40-70% RE exposure typical for RE-focused accredited investors). A 15-25% LS complement provides cycle-independent yield that persists when RE cycles weaken — the specific portfolio-level diversification that other alternatives cannot deliver at competitive yield levels. The decision framework: if your current RE concentration causes you concern (particularly after 2022 CRE stress exposure), evaluate LS complement; if your current allocation feels balanced given your conviction in specific RE positions, holding steady is defensible.
How much LS allocation complements my existing RE position?
The typical complement range is 15-25% of total portfolio, calibrated to the starting RE concentration and overall allocation goals. For portfolios with 60-70% in RE syndications, a 20-25% LS complement (sourced partially from RE reduction and partially from other liquid allocations) meaningfully reduces property-cycle concentration while preserving substantial RE exposure. For portfolios with 40-50% RE, a 15-20% LS complement provides correlation diversification without requiring material RE reduction. For portfolios with less than 40% RE, LS allocation decisions should typically be driven by overall alternatives sleeve construction (see our $1M institutional framework or $2M ultra-institutional framework) rather than specifically as RE complement. The 15-25% range balances meaningful correlation diversification (below 10% doesn't materially shift portfolio-level cycle exposure) against total LS concentration limits (above 25%-30% creates its own single-asset-class concentration). For RE-concentrated portfolios where the investor retains conviction in specific positions, the complement framework allows cycle-independent yield addition without requiring broad RE reduction.
How did LS perform during 2008 vs real estate syndications?
The 2008 global financial crisis produced severe commercial real estate drawdown. Commercial real estate values fell approximately 40% peak-to-trough per NCREIF data, driven by credit market freeze, dramatic cap rate expansion, and refinance market disruption. RE syndication vintage years 2006-2008 experienced substantial distress: many value-add syndications with planned refinances could not execute as credit markets froze, forcing hold period extensions, equity dilution, or forced sales at distressed valuations. Investor outcomes varied substantially by vintage, sponsor quality, debt structure, and specific property fundamentals. Life settlements as an asset class produced yields consistent with target IRR through 2008 — the return mechanism (insured mortality at natural maturity) is structurally independent of credit markets, cap rates, and property fundamentals. Death benefit payouts continued at policy maturities regardless of financial market stress; policy acquisition pricing in secondary markets actually compressed slightly as fewer institutional buyers were active, benefiting direct-ownership investors with capital to deploy. See our recession-proof investments scorecard for the comprehensive cross-cycle performance analysis including 2008, 2020 COVID, and 2022 CRE stress periods. The historical performance validates the structural correlation characteristics but is not predictive — past performance does not guarantee future results, and specific vintage selection and policy quality still matter at the position level.
How do LS and RE tax treatments compare — K-1 depreciation vs LTCG?
The tax treatment structures are fundamentally different and complementary. RE syndications generate K-1 pass-through losses from depreciation (often cost-segregation-accelerated into years 1-5), which shield significant portions of distributed cash from current taxation. The depreciation benefit is real and substantial — many syndications produce paper losses on investor K-1s despite cash-positive distributions during the hold period. However, Section 1250 depreciation recapture bites at exit, taxed at up to 25% federal rate on the depreciation claimed during hold — this nuance erodes after-tax returns substantially and is often underreported in sponsor underwriting materials. LS direct-ownership positions receive long-term capital gains treatment under IRS Revenue Ruling 2020-05 on gain above cost basis at policy maturity — maximum federal rate 20% plus 3.8% NIIT, substantially lower than ordinary income rates and significantly lower than the 25% recapture rate RE syndications face at exit. LS also has no recapture mechanism — the LTCG treatment applies cleanly without the depreciation recapture complexity. The practical implication for RE-complement portfolios: RE syndications optimize for current cash flow with tax-shielded distributions during hold; LS optimizes for maturity payout with LTCG treatment at exit. The two structures together provide tax-diversified cash flow timing (RE current / LS back-loaded) and tax-diversified exit treatment (RE recapture-exposed / LS clean LTCG). For comprehensive tax coordination framework, see our CPA guide for life settlement tax coordination.
How do RE syndication waterfall structures compare to LS payout?
The structures are architecturally different in GP/LP alignment and payout mechanics. RE syndications typically use tiered waterfall structures that allocate profits across preferred return + profit split tiers. Representative structure: LPs receive 100% of distributions up to the preferred return (typically 7-8% annually), then at IRR hurdles the GP participates in increasing share: at 10% IRR hurdle, 75% LP / 25% GP; at 15% hurdle, 65% LP / 35% GP; above 20% IRR, 50% LP / 50% GP (per Morgan analysis of commercial real estate equity waterfalls). This structure aligns GP interests with LP outcomes but creates substantial GP profit participation on strong-performing deals — the GP typically earns 20-30% of upside above the preferred return on successful executions. LS direct ownership has no waterfall structure because there is no GP — the investor acquires beneficial ownership of individual policies and receives 100% of death benefit payout at maturity (less policy-level servicing costs and premium obligations during the hold period). The structural difference affects return dynamics meaningfully: RE syndication investor-level IRR is net of waterfall profit sharing (reported target IRRs reflect LP returns after GP participation); LS direct-ownership target IRR is gross of only servicing costs and premium management, with no profit-sharing structure. This structural simplicity is one reason LS operates with lower target IRR (8-12% vs RE 15-20%) but with higher IRR capture per investment dollar — the LS investor retains the full return structure that remains after position-level costs rather than sharing it with a GP structure.
How does RE sponsor due diligence compare to LS policy due diligence?
The due diligence requirements differ substantially in complexity and skill set. RE syndication due diligence requires evaluating multiple dimensions: sponsor track record (specific deal history, realized returns across cycles, specific property types and markets), business plan credibility (value-add renovation assumptions, exit cap rate assumptions, rent growth assumptions, debt structure feasibility), market analysis (local supply-demand dynamics, employment and demographic trends, cap rate trajectory), legal review (PPM/OM review including waterfall structure, GP compensation, fund expenses, reporting requirements, LP rights including removal provisions), and SEC filing verification (Form D filing on EDGAR, sponsor regulatory history). The due diligence skill set resembles institutional LP work and typically takes 20-40+ hours per deal evaluation; sophisticated accredited investors often engage specialized RE syndication advisors for ongoing deal flow and evaluation. LS policy due diligence has different structural requirements: LE evaluation (certified underwriter reports typically from AVS, 21st Services, Fasano, or Longevity Services providing medical records review and mortality probability analysis), carrier credit evaluation (AM Best rating of issuing insurer, state guaranty association coverage, carrier financial strength), premium schedule verification (minimum required premiums to maintain policy through expected maturity, cost of insurance acceleration schedule), and policy history review (ownership chain, contestability status, premium payment history). The due diligence skill set is specialized and quantitative but more mechanical than RE evaluation; LS policies have narrower variable sets to evaluate. Both asset classes require skilled due diligence; the specific skill domains differ. For RE-sophisticated accredited investors adding LS complement, the LS due diligence requirements are generally lower complexity than their existing RE evaluation workflow, enabling complement allocation without substantial new due diligence infrastructure.
Start with the LS cornerstone complement
Two paths to begin: browse currently available life settlement policies to see what matches your complement cornerstone construction, or schedule a consultation to walk through the complement framework applied to your specific RE syndication concentration.
Or call (833) 250-9677