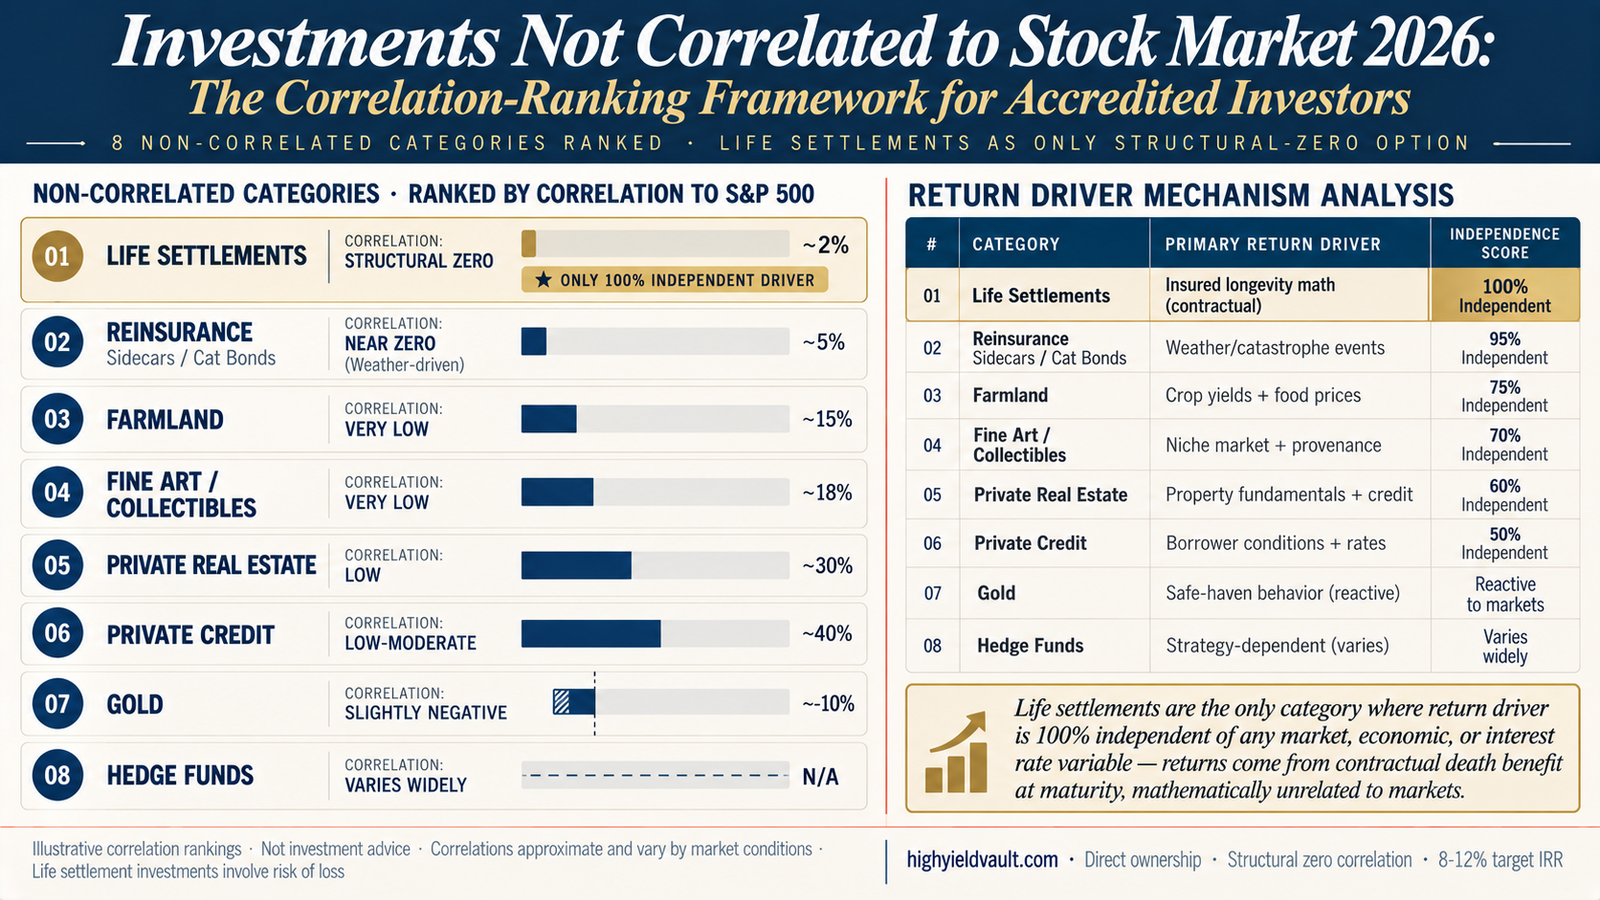
Eight investment categories deliver non-correlated returns in 2026: life settlements (structural zero correlation — insured longevity math), reinsurance sidecars / catastrophe bonds (near zero — weather-driven), farmland (very low — crop yields + food prices), fine art and collectibles (very low — niche markets), private real estate (low — property fundamentals), private credit (low-moderate — borrower conditions), gold (slightly negative — safe-haven behavior), and hedge funds (varies widely by strategy).
Life settlements are the only category where correlation is structurally zero — the return driver (contractual death benefit at insured's natural maturity) is mathematically independent of any market, interest rate, or economic variable. The other 7 categories are "low correlated" but share indirect drivers with public markets (farmland prices move with inflation; private RE values respond to credit availability; gold reacts to market stress). All target IRRs illustrative and not guaranteed. Life settlement investments involve substantial risk including loss of capital and are available only to accredited investors per SEC Rule 501.
Browse life settlement policies for your defensive anchor
Every listing shows full policy documentation, LE reports, AM Best carrier ratings, premium schedules, and projected IRR — so you can evaluate the only structural-zero correlation category firsthand rather than in the abstract.
Browse available policiesWhy non-correlation matters more than ever in 2026
Portfolio correlation is one of the most consequential — and most misunderstood — concepts in accredited investing. A correlation coefficient of +1.0 means two assets move perfectly together; 0.0 means they move independently; -1.0 means they move in exact opposite directions. In practice, almost no asset is perfectly zero-correlated because economic news and macro variables create ripple effects across categories. But a small set of alternative investments stays close enough to zero correlation to function as true portfolio diversifiers rather than duplicative exposures.
Post-2020 market dynamics have made this more consequential than at any point in the past two decades. Correlations between traditional asset classes have shifted significantly — the long-reliable negative correlation between stocks and bonds broke down during the 2022-2023 inflation shock, when both fell simultaneously. The 60/40 portfolio that served as the diversification baseline for a generation lost its structural protection. Accredited investors looking for genuine diversification in 2026 cannot rely on traditional stock-bond balancing alone; they need categories whose return drivers are structurally independent of the forces moving public markets.
What matters at this horizon is not just whether a category "has low correlation historically" but whether the mechanism driving its returns is independent of market variables. Historical correlation can change; a structural independence between return drivers cannot. A category whose underlying return driver is tied to borrower credit (private credit), property fundamentals (private RE), or crop prices (farmland) will always have some indirect linkage to markets through interest rates, credit cycles, and inflation. A category whose underlying return driver is insured longevity (life settlements) has no such linkage — the contractual death benefit at maturity is unchanged whether markets rise, fall, or crash.
The 8 non-correlated categories ranked by correlation strength
Below is the correlation ranking of 8 investment categories that deliver genuinely non-correlated returns, sorted top-to-bottom from strongest (structural zero) to weakest decorrelation (varies-by-strategy hedge funds). The ranking is based on return-driver analysis, not just historical correlation coefficients.
Only life settlements deliver structural-zero correlation — the only category where the return driver is 100% independent of any market, economic, or interest rate variable.
Correlation estimates are approximate and reflect typical market-cycle behavior; correlations are not static and can shift during specific economic conditions. Return-driver analysis identifies the structural mechanism behind each category's returns, not short-term price volatility. Target IRRs vary materially by category — life settlements 8-12% target, farmland 7-10% total return, private credit 8-12% yield, hedge funds strategy-dependent. All projections hypothetical and not guaranteed.
Not sure how LS fits your existing non-correlated allocation?
Schedule a 20-minute consultation. We'll walk through your current non-correlated exposures (private RE, private credit, farmland, gold) and show exactly where structural-zero LS adds diversification versus where you already have overlapping drivers.
Or call (833) 250-9677Return driver analysis: why each category is uncorrelated
Correlation ranking tells us WHICH categories are non-correlated. Return-driver analysis tells us WHY — and more importantly, whether that non-correlation is structural (built into the mechanism of returns) or circumstantial (currently uncorrelated but could shift). Below is the mechanism-by-mechanism breakdown that explains the ranking above.
Life Settlements
Insured longevity math + contractual death benefit at policy maturity. The payment is written into the insurance contract and is unchanged whether markets rise, fall, or crash.
None. No market, interest rate, economic, or sentiment variable affects the eventual contractual payout. The ONLY variables are the insured's actual lifespan (longevity risk) and the carrier's ability to pay (carrier credit risk) — neither of which is market-correlated.
Reinsurance Sidecars
Weather patterns, catastrophe frequency, insurance premium collection vs claims paid during the policy period.
Minimal. Natural disasters correlate loosely with climate cycles but have no structural tie to equity or bond markets.
Farmland
Crop yields, agricultural commodity prices, land value appreciation. Historically strong inflation hedge.
Partial. Food prices move with inflation, which affects interest rates and consumer stocks. Land values respond to borrowing costs.
Fine Art & Collectibles
Niche market demand, artist/piece provenance, rarity, auction cycle timing.
Indirect. HNW buying power expands during bull markets and contracts during downturns — demand correlates with wealth cycles.
Private Real Estate
Property fundamentals, rent collection, operational income, long-term appreciation.
Moderate. Credit availability affects acquisitions; interest rates affect cap rates; vacancy affects distributions during downturns.
Private Credit
Borrower credit conditions, interest rate levels, default rates across loan book.
Significant. Borrower health correlates with economic cycle; defaults spike during recessions; rates set by Fed policy.
Gold
Safe-haven behavior, inflation expectations, USD strength, geopolitical stress.
Reactive. Gold's non-correlation IS its reaction to market stress — it rises specifically because markets fall, not independently of them.
Hedge Funds
Strategy-dependent. Equity market neutral: near zero. Global macro: moderate. Long/short: significant beta exposure.
Highly variable. Non-correlation claims should be verified at the specific strategy level, not accepted at the category level.
Real walkthrough: Michael's defensive portfolio construction
Here's how the correlation-ranking framework applies in practice, illustrated through a composite investor scenario based on the standard pattern for accredited investors building a defensive portfolio ahead of expected equity market volatility.
Pre-recession defensive positioning · $750K deployment across 4 non-correlated categories
Starting position: Michael, a 60-year-old business owner with $3.2M investable, has grown increasingly concerned about equity market concentration risk in his existing 65/35 portfolio. His advisor projects elevated volatility over the next 12-24 months and recommends shifting $750K into a defensive sleeve explicitly designed around non-correlation. Michael's goal: reduce portfolio-level correlation to equity markets by building a sleeve where NO allocation shares drivers with his existing stock exposure.
Category selection process: Michael's advisor walks him through the 8-category correlation ranking. He eliminates hedge funds (correlation varies wildly by strategy, requires manager-level analysis), gold (reactive to markets rather than independent — behaves as a crash hedge but doesn't deliver yield during normal periods), and fine art (illiquid, HNW access complexity). He narrows to the 5 categories delivering structural or near-structural independence — then prioritizes by return driver independence score.
Allocation 01 — Life Settlements ($300K, 40%): Michael deploys the largest sleeve into 2-3 direct-ownership life settlement policies. Selected FIRST specifically because it's the only category with 100% independent return driver — the contractual death benefit at policy maturity is unchanged whether equities crash, rally, or sideways. Target blended IRR: 10.4%.
Allocation 02 — Farmland ($200K, 27%): Diversified farmland fund across US agricultural regions. Return driver tied to crop yields + food prices + land values — partially correlated to inflation but structurally independent of equity market cycles. Target total return: 7-10% blended.
Allocation 03 — Private Real Estate ($150K, 20%): Multifamily syndications in defensive Sun Belt markets. Property fundamentals drive returns — moderate correlation to markets through credit availability but structurally different from equity holdings. Target IRR: 8-10% blended.
Allocation 04 — Private Credit ($100K, 13%): Senior secured direct lending with floating rate structure. Lower allocation acknowledges moderate correlation (borrower defaults rise during recessions) but included for monthly interest cash flow during the LS hold period. Target yield: 8-9% annualized.
Defensive sleeve correlation profile: Blended weighted average correlation to S&P 500 across the $750K sleeve ≈ 0.15 (vs 0.95+ for Michael's existing 65/35 portfolio). During a 20% equity drawdown scenario, this sleeve would mathematically expect to decline less than 5% vs the ~13% drop his equity-heavy portfolio would absorb. The LS cornerstone ($300K) specifically provides the structural zero-correlation anchor; the other three allocations add income during the hold period while maintaining meaningful decorrelation.
Michael's $750K defensive sleeve reflects the standard pattern for accredited investors building portfolios explicitly designed around non-correlation. The LS cornerstone (40%) provides the only structural-zero correlation available; farmland, private RE, and private credit add income-producing allocations with meaningful (though not structural) decorrelation. The framework: when correlation matters most, choose categories where the return driver is structurally independent — not just historically uncorrelated.
Get matched with policies for your defensive allocation
Tell us your target hold period, existing non-correlated exposures, and risk-off time horizon. We'll show you 2-3 vetted life settlement policies specifically matched to your defensive sleeve construction — before you commit anything.
Why direct ownership matters for the structural-zero claim
The structural-zero correlation claim for life settlements only holds when the investor acquires direct ownership of individual policies. In pooled fund vehicles, LS exposure gets wrapped in fund mechanics — manager liquidity decisions, forced sales during redemption pressure, and fee drag during drawdowns — all of which introduce indirect market correlation that doesn't exist in the underlying asset itself. During a 2020-style liquidity crisis, LS funds can trade at NAV discounts because fund investors sell, not because the underlying policies lost value. Direct ownership avoids this entirely: the investor's name is on carrier records, the policy continues toward maturity regardless of broader market conditions, and the contractual death benefit remains unchanged.
The direct-ownership model is the same institutional approach deployed by Apollo Global Management, Berkshire Hathaway, and Partner Re — accessible for accredited individuals at $250K per policy tickets through HYV. Direct ownership is what preserves the structural-zero correlation profile that puts LS at the top of the ranking framework.
See currently available policies for your non-correlated sleeve
Every listing includes full policy documentation, LE reports from certified underwriters, AM Best carrier ratings, premium projections, and projected IRR. Accredited investor verification per SEC Rule 501 required to view specific policies.
Or call (833) 250-9677Frequently asked questions about non-correlated investments
What investments are truly not correlated to the stock market?
Only one investment category delivers truly structural-zero correlation: life settlements, where the return driver (contractual death benefit at insured's natural maturity) is mathematically independent of any market, interest rate, or economic variable. Other categories offer "low correlation" but share indirect drivers with public markets — farmland correlates partially through inflation and food prices; private real estate through credit availability and property cycles; private credit through borrower credit conditions; gold reactively (rising when markets fall rather than independently of them). Reinsurance sidecars and catastrophe bonds come closest to LS's structural independence but are typically institutional-only access. For accessible accredited investor options with structural (not just historical) non-correlation, life settlements stand alone in the ranking.
How is life settlement correlation different from private credit or farmland?
The difference is structural vs circumstantial decorrelation. Life settlements have STRUCTURAL zero correlation — the return driver (insured longevity + contractual death benefit) has NO mechanism to be affected by markets. Whether equities crash, rally, or sideways, the policy pays the same contractual amount at the insured's natural maturity. Private credit has LOW-MODERATE correlation because borrower credit conditions deteriorate during recessions (defaults rise, spreads widen, originations slow) — the return driver shares a mechanism with the broader economic cycle. Farmland has LOW correlation because crop prices and land values respond to inflation and interest rates — not direct equity exposure but shared macro drivers. The practical implication: during a 2008-style financial crisis, private credit funds experienced significant losses from borrower defaults; farmland values declined through credit tightening; LS values held because insured mortality is unaffected by financial crises.
Why isn't gold considered the best non-correlated investment?
Gold's non-correlation is reactive rather than structural. Gold rises specifically BECAUSE markets fall — it functions as a crisis hedge where safe-haven demand increases during market stress. This is useful in crash scenarios but has two meaningful limitations: (1) gold delivers minimal yield during normal periods (no interest, no dividends — only price appreciation potential), so holding gold as a long-term portfolio allocation sacrifices income; (2) gold's crisis-reactive behavior is itself a function of market behavior, which means it's technically correlated (negatively) rather than independent. Life settlements, by contrast, deliver 8-12% target IRR during both normal AND stressed market periods, with returns independent of market direction. For investors specifically seeking a crash hedge rather than a yield-generating diversifier, gold has a role; for yield-generating non-correlation, LS is structurally superior.
How much of my portfolio should be in non-correlated investments?
The appropriate allocation to non-correlated investments varies by investor circumstances but typically falls in the 15-40% range of an accredited investor's total portfolio. Investors heavily concentrated in public equities (70/30 or higher stock allocation) benefit most from larger non-correlated allocations because their traditional diversification (via bonds) has weakened post-2020 as stock-bond correlation increased during inflation shocks. Investors already holding meaningful alternative allocations should ensure those alternatives are genuinely non-correlated by return driver, not just historical correlation. Within the non-correlated allocation itself, prioritize structural-independence first (life settlements as cornerstone) and layer in moderate-correlation income producers (private credit, private RE) for interim cash flow during long-hold LS positions. For specific amount frameworks, see our deployment guides for $250K entry, $500K balanced, and $1M institutional deployments.
Did non-correlated investments actually hold up during 2022-2023?
Performance during 2022-2023 varied significantly by category and specific instrument. Life settlements delivered their contractual target returns at policy maturity — insured mortality was unaffected by equity market declines, inflation, or interest rate shifts, so LS portfolios held during a period when traditional 60/40 portfolios lost 15-20%. Farmland delivered positive returns through strong agricultural commodity prices during inflation. Private real estate experienced mixed results — some sectors (industrial, multifamily) held strong, while others (office) declined meaningfully through structural shifts. Private credit saw spreads widen but managed defaults well through secured positions. Gold rose moderately. Hedge funds varied wildly by strategy. The lesson from 2022-2023 was NOT that all non-correlated categories performed equally — it was that STRUCTURAL non-correlation (LS specifically) outperformed CIRCUMSTANTIAL non-correlation during a period when traditional diversification broke down.
How do I know a category is really non-correlated and not just claimed to be?
Three verification questions filter genuine non-correlation from marketing claims: (1) What is the structural return driver? If the answer involves "market timing," "manager skill," or "strategy sophistication," correlation can shift over time; if the answer involves a contractual, physical, or biological mechanism independent of markets, the non-correlation is structural. (2) What happened during the last three major market dislocations (2008, 2020, 2022-2023)? Historical performance during stress periods reveals circumstantial vs structural decorrelation. (3) Who holds this allocation at the institutional scale? Categories deployed by sophisticated institutional buyers (Apollo, Berkshire, large pension funds, endowments) have been vetted at a level that retail-marketed "non-correlated" products often have not. Life settlements pass all three tests: the return driver is contractual and independent of markets; historical performance held through 2008, 2020, and 2022-2023 dislocations; institutional buyers deploy at scale through the same direct-ownership approach accessible to accredited individuals. See our best alternative investments guide for institutional validation details.
Start with the only 100% independent driver
Two paths to begin: browse currently available life settlement policies to see the structural-zero correlation anchor firsthand, or schedule a consultation to walk through the 8-category framework applied to your specific defensive portfolio objectives.
Or call (833) 250-9677