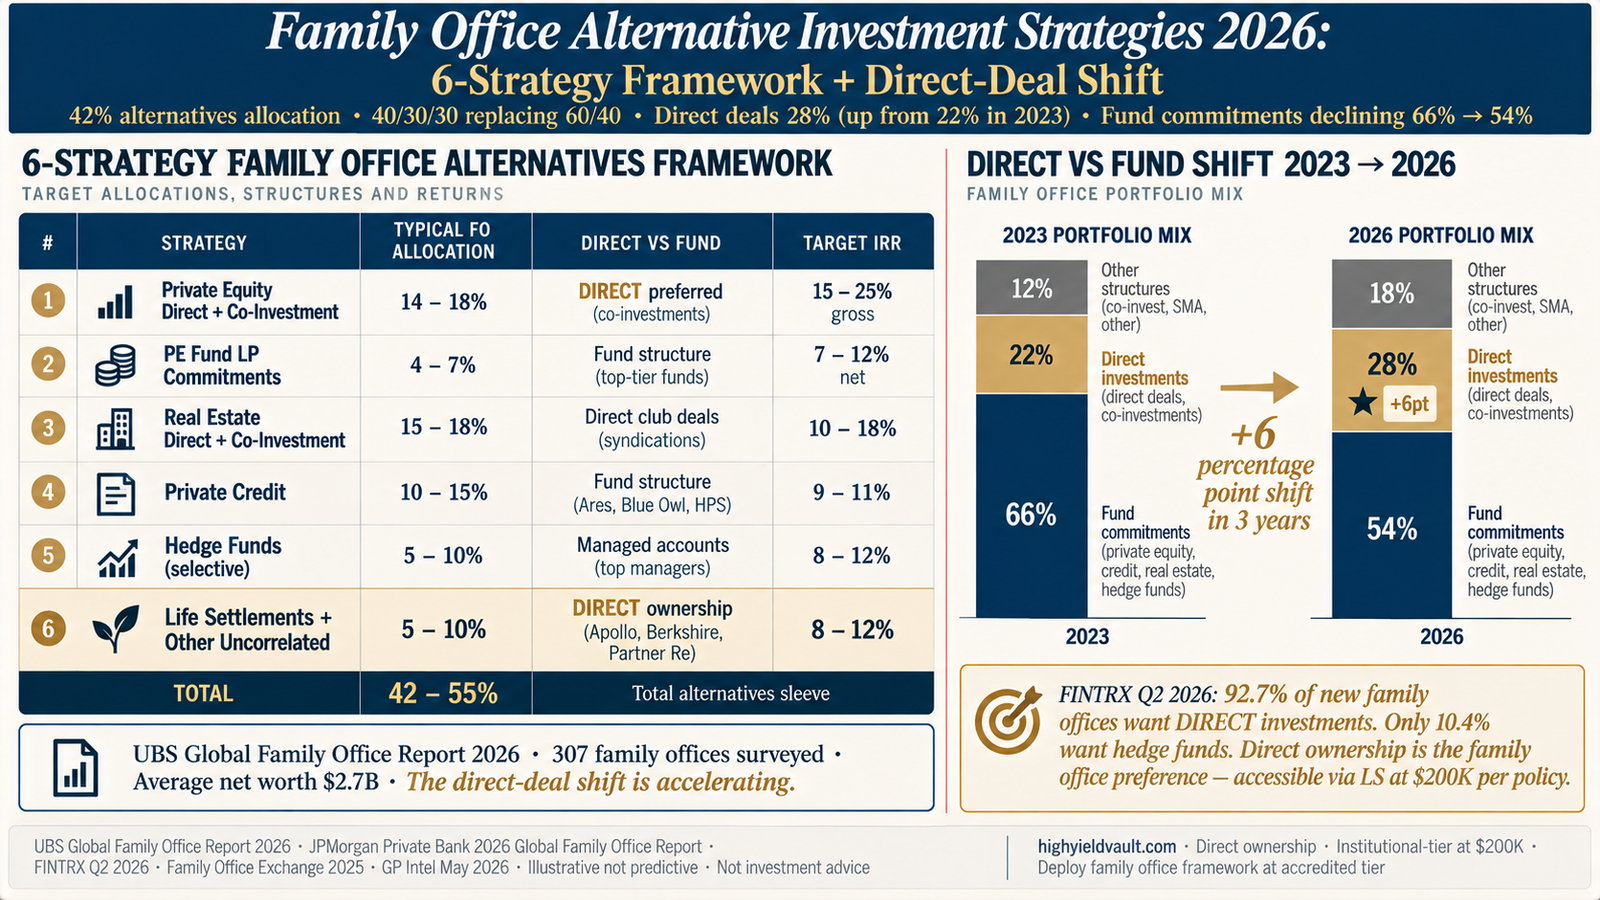
Family office alternative investment strategies in 2026 center on a 6-strategy institutional framework executed with growing preference for direct deals over commingled fund structures. The six core strategies: private equity direct and co-investment (14-18% of total portfolio), PE fund LP commitments (4-7%), real estate direct and co-investment (15-18%), private credit (10-15%, fastest-growing per JPMorgan data), hedge funds (selective, 5-10%, declined from 15-20% a decade ago), and life settlements plus other uncorrelated strategies (5-10%). Total alternatives weighting now reaches 42% per UBS Global Family Office Report 2026 (307 family offices surveyed, average net worth $2.7B).
The structural shift from fund commitments to direct deals is the defining trend. Family office direct investments rose from 22% to 28% of alternatives allocations between 2023 and 2026, while fund commitments declined from 66% to 54%. FINTRX Q2 2026 data on 96 newly-tracked family offices shows the acceleration: 92.7% want direct investments, 89.6% want PE, only 10.4% want hedge funds, and 6.3% want private credit. Target IRR levels diverge sharply by structure: direct PE investments target 15-25% gross IRR versus 7-12% net for fund LP relationships. For accredited investors operating below the $25M+ family office tier, the direct-ownership model mirrors this family office direct-deal preference at scaled capital — life settlements specifically are accessible at $200K per policy via direct ownership, the same institutional approach deployed by Apollo Global Management, Berkshire Hathaway, and Partner Re. All returns illustrative; not guaranteed. Life settlement investments involve substantial risk including loss of capital and are available only to accredited investors per SEC Rule 501.
Browse life settlement policies via direct ownership
Every listing includes LE reports, AM Best carrier ratings, premium schedules, and projected IRR — the data needed to deploy the family office direct-ownership preference at accredited $200K per policy ticket sizes.
Browse available policiesWhy family offices are shifting to direct deals
The direct-deal shift documented by FINTRX, UBS, and JPMorgan reflects three concurrent dynamics affecting family office investment behavior in 2026. First, fee-adjusted performance critique: hedge fund allocations have declined from 15-20% a decade ago to 5-10% today because the 2-and-20 fee structure, compounded over 7-10 year holds, consumes 30-40% of gross returns — and the fee-adjusted performance of most hedge fund strategies has not justified the allocation. The same critique increasingly applies to pooled PE funds. Family offices measuring net-of-fee returns have concluded that direct deals and co-investments produce better risk-adjusted outcomes when the family can access deals of sufficient quality and operational infrastructure permits active management.
Second, club deal infrastructure: GP Intel's May 2026 analysis documented that 60% of direct PE transactions completed by family offices in 2025 were structured as club deals with other family offices. The club-deal structure solves the practical problem that most individual family offices lack sufficient scale for institutional-grade direct deal flow (requiring $25M-$100M+ check sizes for competitive positioning in intermediated deal processes). By pooling capital across 3-7 family offices, the club structure accesses institutional deal flow while retaining the direct-ownership advantages (no 2-and-20 fee structure, position-specific due diligence, direct relationship with portfolio company management). Infrastructure for club-deal formation has matured substantially since 2020, with specialized platforms, legal frameworks, and ongoing relationships between family office CIOs now facilitating structures that were ad-hoc a decade ago.
Third, generational shift: FINTRX data on newly-added family offices (96 added in Q2 2026 alone) shows pronounced preference for direct investments and private equity among newer, often entrepreneurially-formed family offices. These families — many formed through tech, private equity, or healthcare liquidity events — bring operational preferences from their wealth-creation environments: direct deal execution, hands-on involvement in portfolio companies, and skepticism of intermediated fund structures. Patrick Galvin at FINTRX has documented that this cohort "gravitates heavily toward direct and equity-oriented strategies rather than externally managed fund structures." As this cohort grows as a share of the family office universe, aggregate direct-deal preference accelerates.
The 6-strategy family office framework
The matrix below shows the 6-strategy family office alternative investment framework for 2026, with typical allocation percentages, direct vs fund structure preference, target IRR ranges, and named institutional allocators per strategy. The LS strategy is highlighted as the strategy specifically accessible to accredited investors below family office tier via direct-ownership deployment.
Club deals · 60% of 2025 PE deals
KKR · Blackstone · Carlyle
Blackstone · Starwood · Brookfield
Ares · Blue Owl · HPS · Oaktree
Bridgewater · Citadel · Millennium
Apollo · Berkshire · Partner Re
The 6-strategy framework shows family offices preferring direct and co-investment structures for PE, RE, and LS, with fund structures retained for strategies where operational scale or specialized access justifies pooled vehicles.
Allocation percentages reflect approximate category weightings based on cross-source 2026 institutional surveys including UBS Global Family Office Report 2026 (307 family offices surveyed, average net worth $2.7B, average AUM $1.3B), JPMorgan Private Bank 2026 Global Family Office Report, FINTRX Q2 2026 data (96 newly-added family offices tracked), Family Office Exchange 2025 survey, GP Intel May 2026 club deal analysis, and Goldman Sachs 2025 Family Office Investment Insights. Specific family office allocations vary substantially by family size, generation, source of wealth (entrepreneurial vs inherited), investment preferences, geographic focus, and operational infrastructure. Representative data points: UBS 2026 shows PE direct + funds 22% (down from 25% in 2024, "down sharply"), public equities 31% (up from 26% in 2024); JPMorgan 2026 total private investments 30.8% with private credit as fastest-growing sub-allocation; FINTRX Q2 2026 newly-added family offices 92.7% interested in direct investments, 89.6% PE, 10.4% hedge funds, 6.3% private credit; Family Office Exchange 2025 shows 62% of family offices with $500M+ assets making direct PE investments; GP Intel May 2026 shows 60% of direct PE transactions completed in 2025 structured as club deals. Named institutional allocators and asset managers referenced (KKR, Blackstone, Carlyle, Starwood Capital, Brookfield, Ares Management, Blue Owl, HPS Investment Partners, Oaktree, Bridgewater, Citadel, Millennium, Apollo Global Management, Berkshire Hathaway, Partner Re) are referenced based on publicly-documented asset management activities and do not imply endorsement, affiliation, or partnership with High Yield Vault.
Mirror the family office direct-deal preference
Schedule a 20-minute consultation. We'll walk through the family office framework, identify which strategies apply at your capital tier, and show how LS specifically delivers institutional-tier direct ownership at accredited $200K ticket sizes.
Or call (833) 250-9677The direct vs fund shift: 2023 to 2026
The visualization below shows the structural shift in family office alternative investment approach between 2023 and 2026. Direct investments rose by 6 percentage points as a share of alternatives allocations, while fund commitments declined by 12 points. The 6-point swing is substantial — in a 42% alternatives sleeve, 6 percentage points represents approximately 2.5% of total portfolio moving from fund to direct structures across the family office universe.
Allocation shift based on altss.com cross-source analysis of family office LP behavior 2023-2026 · FINTRX Q2 2026 shows newly-added family offices 92.7% direct investment preference, 10.4% hedge fund interest
The direct-deal shift is the defining structural trend in 2026 family office alternative investment. Direct ownership — the same approach LS makes accessible at $200K ticket — is the family office preference, not a workaround.
Real walkthrough: Winthrop Family Office alternatives expansion
Here's how the 6-strategy family office framework applies in practice, illustrated through a composite scenario based on the standard pattern for mid-size family offices expanding alternatives allocation in 2026.
Mid-size family office · $45M portfolio expanding alternatives from 35% to 45%
Starting position: The Winthrop Family Office (illustrative composite) oversees $45M for three generations of a family whose wealth originated from a 2008 manufacturing business sale. Current portfolio composition: $20M (44%) public equities across diversified managers, $9.5M (21%) muni and taxable bonds, $2M (4%) cash, and $13.5M (30%) across alternatives (6 PE fund LP positions, 3 real estate syndications, 2 hedge fund multi-strategy allocations, 1 private credit fund). Dedicated internal CIO with 15 years of institutional investment experience plus multi-family office advisory relationship.
The strategic review: CIO conducts annual portfolio review and identifies three alignment gaps versus 2026 family office benchmarks. First, alternatives allocation at 30% is meaningfully below the 42% UBS peer benchmark — the family's conservative tilt from 2008 crisis experience has created a drag versus peer families' returns over the 2020-2026 period. Second, structure composition is fund-heavy (85% fund commitments vs 15% direct) at a time when peer families are shifting toward 54% fund / 28% direct / 18% other structures. Third, uncorrelated strategy exposure is zero — portfolio lacks allocation to LS, infrastructure, farmland, or other strategies providing structural correlation diversification beyond equities and interest-rate-sensitive alternatives.
Framework expansion decision: Family office CIO proposes to the family's investment committee a 3-year alternatives expansion from 30% to 45% of portfolio (adding approximately $6.75M to alternatives sleeve), executed with specific structure and category rebalancing. Target composition post-expansion: $4.5M PE direct + co-investment (club deal structure with 2 peer family offices), $2M PE fund LP commitments (maintained for top-decile GP relationships), $4.5M real estate direct and co-investment, $3.6M private credit, $1.5M hedge funds (reduced from $2M, maintained only for genuinely uncorrelated strategies), $4M life settlements plus other uncorrelated strategies (new allocation). Total alternatives: $20.1M (45%).
LS strategy deployment: The $4M LS allocation is structured as institutional direct ownership across 15-20 life insurance policies (approximately $200K-$500K per policy, blended target IRR 10.1%). The family office engages HYV for institutional-tier policy sourcing with the understanding that the direct-ownership model mirrors the family office's broader direct-deal preference. Policy selection emphasizes mortality curve diversification (varied age cohorts, varied underlying health profiles), carrier diversification (6-8 different A-rated issuing insurers), and LE staggering across the 15-20 policy portfolio to produce portfolio-level maturity timing diversification. The LS allocation functions as the correlation diversifier the family's prior portfolio lacked.
Projected outcome: The expanded 45% alternatives allocation targets blended portfolio IRR of 8.5-9.5% across the full $45M portfolio (vs 7.2% baseline on current composition), driven by meaningful uplift from PE direct (15-25% gross target), real estate direct (10-18% target), and LS cornerstone (8-12% target). More importantly, structural correlation characteristics improve substantially: the $4M LS allocation (8.9% of total portfolio) adds genuinely uncorrelated yield that persists when equity markets, rate markets, and credit markets face stress simultaneously. The direct-tilt rebalancing also reduces aggregate fee drag by approximately 0.4-0.6% annually, which compounds to meaningful wealth differential over multi-generational horizons. The framework alignment moves the Winthrop Family Office from a conservative 2008-anchored allocation to a 2026-current family office posture.
The Winthrop deployment reflects the standard pattern for mid-size family offices expanding alternatives allocation in 2026 to align with peer benchmarks and structural preferences. The framework: family offices at any size can execute meaningful alignment with the 6-strategy institutional framework by combining direct-deal structures across PE, RE, and LS with maintained fund commitments for strategies where operational scale or specialized access justifies pooled vehicles. For accredited investors below the $25M+ family office tier, the same direct-ownership preference applies at scaled dollars — LS specifically accessible at $200K per policy mirrors the institutional direct-deal preference at individual investor tier.
Get matched with policies for your LS allocation
Tell us your current alternatives sleeve composition, target LS allocation, and investment horizon. We'll show you 2-3 vetted life settlement policies specifically matched to anchor the LS strategy within your family-office-aligned 6-strategy framework.
Why direct ownership is the family office institutional approach
The family office preference for direct-deal structures across PE, RE, and LS is not primarily about fee avoidance — though lower aggregate fee drag is a secondary benefit. The structural preference reflects three deeper advantages that family office CIOs have documented in survey after survey. First, position-level transparency: direct ownership provides visibility into specific portfolio holdings, operational performance metrics, and risk characteristics that fund-wrapped structures either obscure or report with substantial lag. Family offices measuring portfolio-level risk benefit from granular position data that enables informed rebalancing decisions.
Second, timing control: direct ownership eliminates the capital-call ramp (J-curve) typical of pooled fund structures and provides flexibility on exit timing. For LS specifically, direct ownership means the investor receives death benefit payout at policy maturity rather than waiting for fund NAV calculations and distribution decisions by a GP. For PE and RE direct deals, timing flexibility allows family offices to hold or exit positions based on specific investment thesis evolution rather than fund-level liquidity requirements. Third, relationship capital: direct deals build relationships with portfolio company management (PE), property operators (RE), and policy owners/structuring intermediaries (LS) that produce ongoing deal flow and strategic optionality. Fund structures interpose the GP, limiting LP-level relationship development.
For accredited investors below the family office tier, the direct-ownership model is accessible for LS specifically through platforms like HYV at $200K per policy ticket sizes. This is the same institutional approach deployed by Apollo Global Management, Berkshire Hathaway, and Partner Re at scale — scaled to accredited rather than family-office minimums. The direct-ownership structure preserves target IRR (8-12%) that pooled vehicles compress through fee drag; preserves position-level transparency; preserves timing flexibility (receive full death benefit at maturity rather than fund NAV); and preserves the structural advantages family offices increasingly prefer. The direct-deal preference is not a workaround — it is the institutional standard that accredited-tier investors can now access.
See currently available policies via direct ownership
Every listing includes full policy documentation, LE reports from certified underwriters, AM Best carrier ratings, premium projections, and projected IRR. Accredited investor verification per SEC Rule 501 required to view specific policies.
Or call (833) 250-9677Frequently asked questions about family office alternative investment strategies
What's the capital threshold for a true family office?
Family office tier typically starts at approximately $25M-$30M in investable assets for a single-family office structure to become economically justified, with most dedicated single-family offices operating at $50M-$100M+ in assets. Below that threshold, families typically access institutional-tier capabilities through multi-family office relationships at firms like WE Family Offices (average family $180M per managing partner Michael Zeuner), Market Street Trust Company (average family $50M per CIO Marc Dizard), Bessemer Trust, or boutique multi-family office structures that aggregate dedicated infrastructure across multiple families. The UBS Global Family Office Report 2026 surveys family offices with average net worth $2.7B and AUM $1.3B — well above the operational minimum. For accredited investors operating below the $25M-$30M family office threshold, the 6-strategy framework still applies directionally: alternatives weighting of 20-30% (vs 42-55% UHNW family office), direct-ownership preference where accessible (LS at $200K per policy, RE syndications LP positions, PE feeder funds for institutional GP access), and fund structures retained where operational scale or specialized access justifies pooled vehicles. See our UHNW allocation framework for the retail-vs-UHNW gap analysis and $2M ultra-institutional framework for the tier directly below family office.
How do accredited investors below family office tier access direct deals?
Direct-deal access for accredited investors below the family office tier varies substantially by asset class. For life settlements, direct-ownership access is operationally straightforward: platforms like HYV provide institutional-grade policy sourcing with $200K per policy minimum ticket sizes — the accredited investor acquires beneficial ownership of individual policies rather than fund units. The direct-ownership structure delivers the same institutional approach Apollo, Berkshire, and Partner Re use at scale. For real estate, direct ownership is accessible through single-asset syndications or small direct partnerships, with the operational complexity of sponsor due diligence and K-1 management. For private equity, direct deals typically remain inaccessible to accredited investors due to minimum commitment requirements ($5M+ for top-decile GPs direct, $25M+ for institutional club deal participation); feeder fund structures bridge the access gap with the tradeoff of fee drag. For private credit, hedge funds, and infrastructure, direct access typically requires the operational scale and relationships that family offices maintain. The practical implication: accredited investors can meaningfully participate in the family office direct-deal preference specifically for LS and (with greater operational complexity) RE, while PE/PC/HF typically require intermediated access structures. For the specific accessible frameworks by capital tier, see our guides for $250K entry, $500K balanced, $1M institutional, and $2M ultra-institutional.
Why did family offices reduce hedge fund allocations from 15-20% to 5-10%?
The decade-long reduction in family office hedge fund allocation (from 15-20% a decade ago to 5-10% today per cross-source institutional data) reflects fee-adjusted performance critique that has accumulated over multiple cycles. The 2-and-20 fee structure (2% management plus 20% performance above a hurdle) compounded over 7-10 year family office hold periods consumes 30-40% of gross returns — and most hedge fund strategies have not produced net-of-fee returns justifying that fee drag versus simpler alternatives. The critique has been particularly acute for fund-of-funds structures (which stack fees on fees), long-biased equity hedge funds (which family offices concluded could be replicated more cheaply through direct equity exposure or smart beta), and strategies that have not demonstrated true alpha-generation independent of equity market direction. Hedge fund allocations have stabilized at the 5-10% level for specific strategies that genuinely diversify (global macro, event-driven, systematic/quantitative) and where the manager has demonstrated multi-cycle alpha. The FINTRX Q2 2026 data showing only 10.4% of newly-added family offices interested in hedge funds suggests the trend may continue — newer family offices with fewer legacy allocations are structurally skeptical of the asset class. For sophisticated accredited investors, the family office critique applies similarly: hedge fund access typically requires $500K-$1M+ minimums, fee drag is substantial, and simpler alternatives (direct ownership LS for correlation diversification, direct PE deals for growth, direct RE for income + appreciation) often deliver better fee-adjusted outcomes.
How do life settlements fit within family office alternative strategies?
Life settlements sit within the "other alternatives" or "uncorrelated strategies" bucket in family office alternatives sleeves, typically representing 2-5% of total portfolio for family offices that allocate to the asset class (not all do). At the specific family office allocation level, LS deployment is almost universally direct-ownership rather than fund-wrapped — the institutional approach that Apollo Global Management, Berkshire Hathaway, and Partner Re use at scale. The appeal for family offices is specific: mortality-driven returns structurally independent of equity, credit, and real estate cycles; yield of 8-12% target IRR competitive with lower end of PE and RE returns; back-loaded cash flow structure that complements the ongoing distribution pattern from PE/RE/PC positions; LTCG tax treatment under IRS Revenue Ruling 2020-05 that compounds pre-tax yield advantage at family-office federal tax brackets. The structural limitation at family office scale is sourcing: institutional-quality LS deal flow at $5M+ check sizes is more constrained than PE/RE/PC alternatives, and some family offices allocate zero rather than build the sourcing infrastructure. For accredited investors below family office tier, the structural dynamics flip favorably: the $200K-$500K per policy ticket sizes accessible via HYV are precisely the range where LS deal flow is deepest, enabling accredited investors to execute direct-ownership LS strategy more easily than many family offices can at their larger required ticket sizes. The direct-ownership model specifically delivers the family office institutional approach at accredited tier — same asset class, same return mechanism, same structural approach, scaled to accredited rather than institutional minimums.
PE direct 15-25% IRR vs fund LP 7-12% — why the gap?
The gap between PE direct deal gross IRR (15-25% target per family office benchmarks) and PE fund LP net IRR (7-12% target net of all fees) reflects two structural factors. First, fee drag: fund structures impose 2-and-20 fees (2% management + 20% carried interest above a hurdle) that compound over 7-10 year holds to consume approximately 40-50% of gross returns at typical performance levels. A fund deal returning 20% gross IRR delivers roughly 10-12% net to LPs; a direct deal returning the same 20% gross IRR delivers approximately 18-19% to the family office after only operational costs. Second, selection effect: family offices doing direct deals apply institutional-quality due diligence to specific transactions, often with sector expertise or operational relationships that produce informational advantages. The direct-deal transactions family offices execute are not representative of the full PE opportunity set — they are specifically selected deals where family office infrastructure provides competitive advantage. Direct PE IRR data (15-25% gross target) reflects both the fee advantage AND the selection effect, so the comparison is not purely apples-to-apples with fund LP returns (7-12% net target reflects average fund outcomes net of fees). The practical implication for family offices: direct deals are not categorically superior to fund structures — they are superior when the family office has sufficient scale, infrastructure, and specialized expertise to execute institutional-quality direct deal flow. For accredited investors below family office tier, direct PE access typically requires $5M+ check sizes and institutional-quality due diligence operational infrastructure; feeder fund access remains the practical path at lower check sizes despite the fee drag disadvantage.
Is the 40/30/30 model replacing 60/40 the right framework for all family offices?
The 40/30/30 model (40% equity / 30% fixed income / 30% alternatives) referenced in multifamily office research as replacing traditional 60/40 is a directional benchmark rather than a universal prescription. Specific family office allocations vary substantially based on multiple dimensions. Family size matters: larger family offices ($1B+) typically allocate higher alternatives percentages (42-55% per UBS Global Family Office Report) because scale enables access to deals and strategies unavailable to smaller families. Generation matters: entrepreneurial first-generation family offices (post-liquidity event) typically allocate higher alternatives and higher direct-deal weightings than inherited multi-generational families with established fund relationships. Time horizon matters: family offices planning for multi-generational wealth transfer can accept higher illiquid allocations (alternatives weighted toward long-duration PE, RE, infrastructure) than families with specific intergenerational liquidity events planned (education funding, charitable commitments, family business transitions). Risk tolerance matters: McKinsey research documents family offices pursuing either conservative 5-6% target returns or growth-oriented 15% target returns, with the 40/30/30 and 42% alternatives benchmarks representing median rather than universal preferences. For accredited investors, the directional implication is clear: traditional 60/40 is being replaced across institutional and family office tiers with higher alternatives weightings, but the specific weighting and composition should reflect individual circumstances rather than peer benchmark replication. The 6-strategy framework applies with scaled weightings at any tier where the structural capabilities (direct-ownership access for LS and some RE, feeder fund access for PE at $2M+, institutional fund access for PC and selective HF) are operationally available.
Start with the direct-ownership LS strategy
Two paths to begin: browse currently available life settlement policies to see what matches your family-office-aligned LS allocation, or schedule a consultation to walk through the 6-strategy framework applied to your specific capital tier and alternatives sleeve composition.
Or call (833) 250-9677