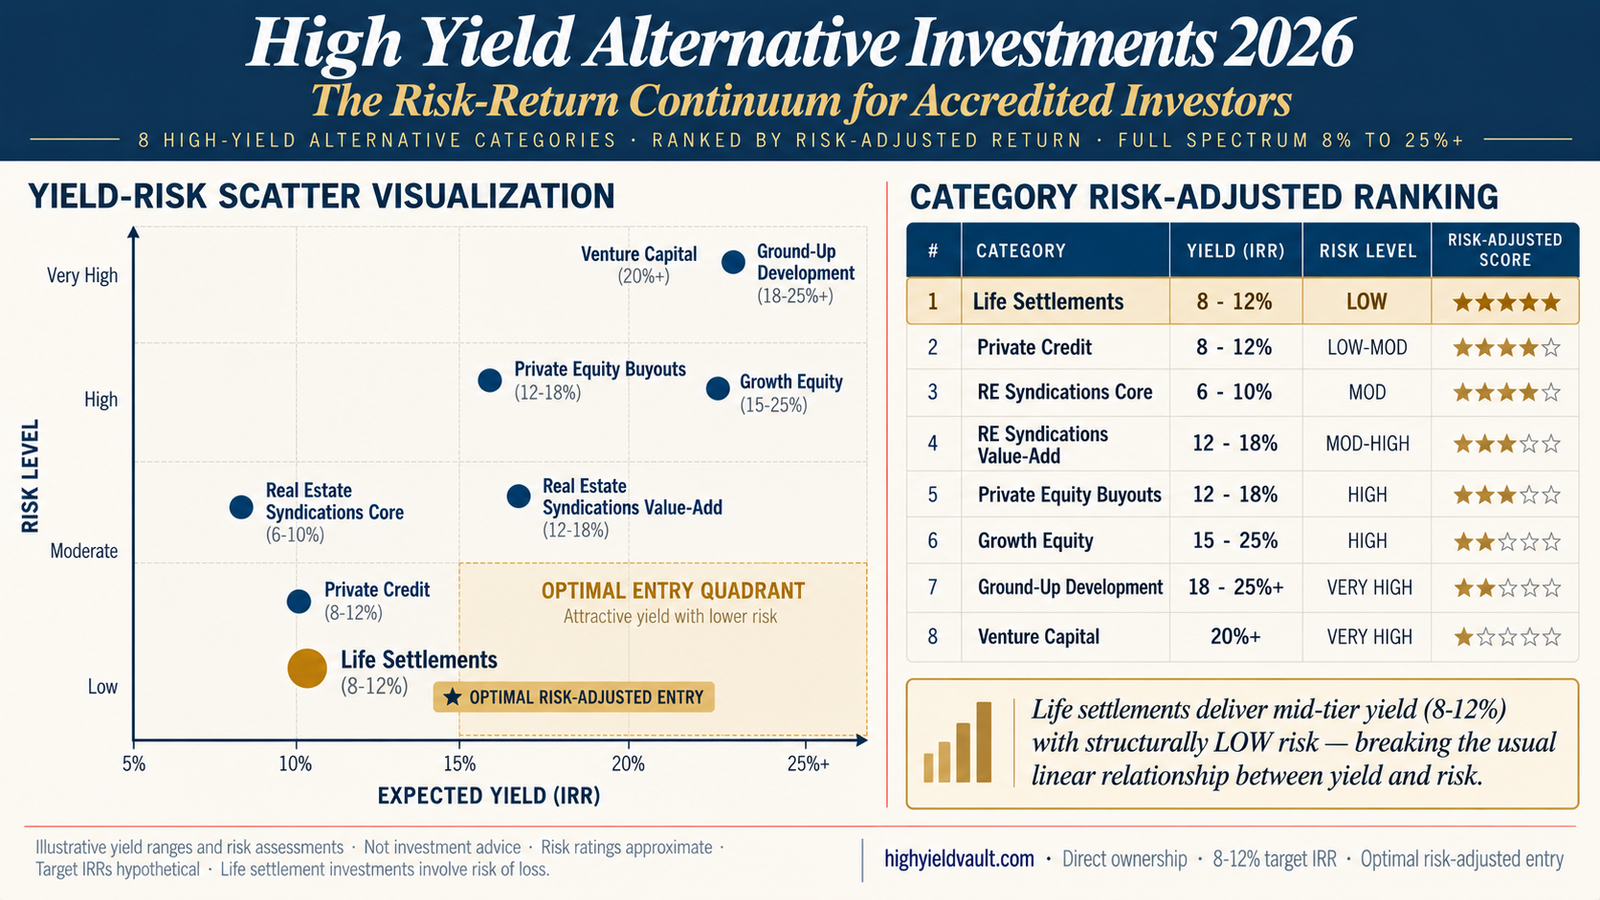
Eight high-yield alternative investment categories span the full risk-return continuum in 2026: life settlements (8-12% target IRR, LOW structural risk — optimal risk-adjusted entry), private credit (8-12% yield, low-moderate risk), real estate syndications core (6-10% distributions, moderate risk), real estate syndications value-add (12-18% IRR, moderate-high risk), private equity buyouts (12-18% net IRR, high risk), growth equity (15-25% returns, high risk), ground-up development (18-25%+ IRR, very high risk), and venture capital (18.5% 10-year index with 20%+ potential, very high risk).
Life settlements rank first on risk-adjusted return because they deliver mid-tier yield (8-12%) with structurally low risk thanks to the contractual death benefit mechanism — a profile no other high-yield category matches. Other categories scale yield proportionally with risk (PE, VC, development projects). All returns illustrative; not guaranteed. Life settlement investments involve substantial risk including loss of capital and are available only to accredited investors per SEC Rule 501.
Browse life settlement policies delivering 8-12% at low structural risk
Every listing includes LE reports, AM Best carrier ratings, premium schedules, and projected IRR — the data you need to evaluate the only high-yield category breaking the usual yield-per-risk tradeoff.
Browse available policiesWhy "high yield alternative" is a spectrum, not a category
One of the most common framing mistakes in accredited investor allocation is treating "high yield alternatives" as a single category rather than a continuum of risk-return profiles. Private credit at 8-12% yield and venture capital at 20%+ potential returns both qualify as "high yield alternatives" in the SERP sense — but they have almost nothing in common structurally. Private credit delivers predictable monthly interest with secured lending protection; venture capital delivers power-law outcomes where 80% of returns come from 20% of deals, with most portfolio companies failing entirely.
The accredited investor who treats "high yield alternatives" as one category typically ends up either (a) over-weighting conservative options and missing optimization opportunities, or (b) over-weighting opportunistic categories without understanding the concentrated risk they're taking. The correct framework starts by mapping each category onto its specific position in the risk-return continuum, then selecting categories based on risk-adjusted return rather than headline yield alone.
In the standard yield-per-risk relationship, higher yield comes with proportionally higher risk — private credit at 10% carries less risk than private equity at 15%, which carries less risk than venture capital at 20%+. This linear relationship is broadly true across the spectrum, with one notable exception. Life settlements deliver mid-tier yield (8-12%) with structurally low risk because the return mechanism is contractual (death benefit at policy maturity) rather than execution-dependent (deal success, borrower creditworthiness, business operations). This structural distinction is what makes LS the optimal risk-adjusted entry point in the high-yield alternatives continuum.
The 8 high-yield categories ranked by risk-adjusted return
Below is the risk-adjusted return ranking of 8 investment categories delivering yields in the high-yield alternative spectrum (8%+ target returns), sorted top-to-bottom from strongest risk-adjusted score (★★★★★) to weakest (★☆☆☆☆). The ranking weights both yield achieved AND risk required to achieve it.
Only life settlements deliver mid-tier yield (8-12%) with structurally LOW risk — breaking the usual linear relationship between yield and risk.
Yield ranges reflect consensus 2026 data from institutional-tier sources. Risk ratings are approximate and reflect typical category profiles; individual investments within each category vary substantially. Risk-adjusted scores (★ ratings) weight yield achieved against risk required and are illustrative, not quantitative portfolio modeling. Hold periods are typical ranges; actual commitments vary by specific fund or asset.
Not sure where LS fits your existing high-yield allocation?
Schedule a 20-minute consultation. We'll walk through your current high-yield exposures (private credit, RE syndications, PE commitments) and show where LS adds optimal risk-adjusted entry versus where you may already have category overlap.
Or call (833) 250-9677The yield-risk scatter: where each category lives
The ranking table above shows the 8 categories individually. The scatter visualization below plots them together on two dimensions — target yield (horizontal axis) and risk level (vertical axis) — so the optimal entry quadrant becomes visible at a glance. The bottom-right-mid zone (mid-high yield, low risk) is the "optimal entry quadrant" that most accredited investors want to occupy. Only one category among the eight lives there.
very high risk
very high risk
low risk
low risk
(optimal entry)
Reading the scatter: seven of the eight high-yield alternatives cluster along the standard risk-return line — higher yield requires proportionally higher risk. Venture capital, growth equity, and ground-up development concentrate in the top-right (highest yield at very high risk). PE buyouts and RE value-add sit in the mid-right high-risk zone. RE core and private credit anchor the lower-risk end at moderate yield. Life settlements alone occupy the optimal entry quadrant — bottom-right-mid — delivering 8-12% target IRR at structurally low risk thanks to the contractual death benefit mechanism. This is what makes LS the risk-adjusted winner across the full high-yield spectrum.
Real walkthrough: Rebecca's category selection by risk tolerance
Here's how the risk-return continuum framework applies in practice, illustrated through a composite investor scenario based on the standard pattern for accredited investors selecting from the full high-yield alternatives spectrum.
Moderate-risk accredited investor · $600K allocation across the optimal risk-adjusted entry quadrant
Starting position: Rebecca, a 55-year-old attorney with $2.8M investable, has defined her risk tolerance clearly: she wants meaningful yield (above traditional bonds and dividend portfolios) but is unwilling to accept the volatility and loss potential of concentrated PE/VC exposures she sees in her peers' portfolios. Her goal: deploy $600K into high-yield alternatives that deliver 8-12%+ returns at risk profiles she can defend to herself and her CPA at year-end tax planning sessions.
Category elimination process: Rebecca works through the 8-category continuum. She eliminates venture capital (★☆☆☆☆ risk-adjusted — power-law distribution means most individual positions fail, requires 15-20+ position diversification to achieve the index return she couldn't commit to anyway), ground-up development (★★☆☆☆ — execution and market-timing risk unacceptable), growth equity (★★☆☆☆ — too strategy-dependent for her sophistication level). She narrows to the ★★★★★ and ★★★★☆ categories: life settlements, private credit, and real estate syndications core.
Allocation 01 — Life Settlements ($300K, 50%): Rebecca deploys the largest sleeve into 2 direct-ownership life settlement policies. Selected first specifically because it holds the ★★★★★ risk-adjusted score — 8-12% target IRR at structurally LOW risk thanks to contractual death benefit mechanism. The risk components (longevity extension, carrier credit) are specific and bounded, unlike the open-ended risks of PE/VC. Target blended IRR: 10.2%.
Allocation 02 — Private Credit ($200K, 33%): Diversified private credit fund with secured lending across middle-market borrowers and real estate sponsors. ★★★★☆ risk-adjusted score — 8-12% yield at low-moderate risk thanks to secured positions and shorter 3-year hold. Monthly interest distributions during the LS hold period provide interim cash flow.
Allocation 03 — Real Estate Syndications Core ($100K, 17%): Two multifamily core syndications in defensive Sun Belt markets. ★★★★☆ risk-adjusted score — 6-10% distributions at moderate risk with hard-asset backing. Quarterly cash-on-cash distributions during the hold period.
Portfolio risk-adjusted outcome: Weighted average risk-adjusted score ≈ 4.5 stars (vs ~2.0 for a VC/PE-heavy allocation of the same size). Blended target IRR ≈ 9.6% at a risk profile Rebecca can rationally defend. The LS cornerstone ($300K) specifically anchors the sleeve in the optimal entry quadrant; the other two allocations add income-producing exposures that maintain the risk-adjusted framework.
Rebecca's $600K deployment reflects the standard pattern for moderate-risk accredited investors who understand "high yield alternative" as a spectrum requiring category-by-category selection. The LS cornerstone (50%) anchors the sleeve in the ★★★★★ risk-adjusted quadrant; private credit and RE syndications core add income-producing exposures that complement without compromising the risk-adjusted framework. The framework: when yield matters AND risk matters, select categories by risk-adjusted score — not by headline yield alone.
Get matched with policies for your risk-adjusted sleeve
Tell us your risk tolerance, target yield, and existing high-yield exposures. We'll show you 2-3 vetted life settlement policies specifically matched to your optimal entry positioning — before you commit anything.
Why direct ownership preserves the risk-adjusted score
The ★★★★★ risk-adjusted score for life settlements only holds when the investor acquires direct ownership of individual policies. In pooled fund vehicles with 2-and-20 fee structures, the fee drag over 7-10 year holds consumes 30-40% of gross IRR — compressing the LS category's 8-12% target yield into a 5-7% net return at the investor level. At that compression, LS no longer sits in the ★★★★★ optimal entry quadrant — it drifts toward ★★★☆☆ territory where the yield advantage over private credit disappears. Direct ownership is what preserves the structural low-risk profile AND the 8-12% target IRR simultaneously at the investor level.
The direct-ownership model is the same institutional approach deployed by Apollo Global Management, Berkshire Hathaway, and Partner Re — accessible for accredited individuals at $250K per policy tickets through HYV. Direct ownership is what keeps LS in the ★★★★★ risk-adjusted position across the full high-yield alternatives continuum.
See currently available policies in the ★★★★★ risk-adjusted zone
Every listing includes full policy documentation, LE reports from certified underwriters, AM Best carrier ratings, premium projections, and projected IRR. Accredited investor verification per SEC Rule 501 required to view specific policies.
Or call (833) 250-9677Frequently asked questions about high-yield alternative investments
What is considered a "high yield" alternative investment in 2026?
In 2026, "high yield alternative investments" generally refers to accredited-investor categories targeting returns above traditional fixed income benchmarks (5-6% for investment-grade bonds). The high-yield alternative threshold typically starts at 8% annual target yield and extends through the 25%+ opportunistic range. The 8 primary categories span: life settlements (8-12% target IRR), private credit (8-12% yield), real estate syndications core (6-10% distributions), real estate syndications value-add (12-18% IRR), private equity buyouts (12-18% net IRR), growth equity (15-25% returns), ground-up development (18-25%+ IRR), and venture capital (18.5% 10-year index with 20%+ potential). Not all high-yield alternatives carry equivalent risk — the risk-adjusted framework in this guide ranks them by yield achieved relative to risk required.
Why do life settlements rank highest on risk-adjusted return?
Life settlements rank first on risk-adjusted return because they're the only high-yield alternative category where the return mechanism is CONTRACTUAL rather than execution-dependent. The death benefit at policy maturity is written into the insurance contract — the carrier is contractually obligated to pay the full benefit amount upon the insured's natural passing. This structural mechanism separates LS from other high-yield categories where returns depend on execution variables: PE buyouts require successful business operations, VC requires power-law outcomes from startups, ground-up development requires construction execution and market absorption, growth equity requires scaling success, syndications require operator performance. All those execution variables introduce risk that LS structurally avoids. The remaining risks for LS (longevity extension, carrier credit, servicing) are specific and bounded, measurable through actuarial analysis and AM Best ratings — unlike the open-ended execution risks of other high-yield categories.
Should I pursue venture capital for higher returns than life settlements?
The question depends on whether you can tolerate venture capital's power-law risk distribution. VC's 10-year index sits at 18.5% per PitchBook — meaningfully higher than LS's 8-12% target range. But this headline return assumes you can achieve the INDEX, which requires either (a) direct access to top-decile VC funds (typically closed to new LPs or requiring $5M+ minimums), or (b) building a diversified portfolio of 15-20+ individual VC positions to capture the power-law distribution across your own book. Most individual accredited investors cannot access top-decile funds and cannot deploy enough capital for genuine diversification — meaning their actual VC experience looks much more like the 2021-vintage down-round scenarios than the Airbnb/Stripe 50-100x outcomes that drive the index average. On risk-adjusted basis for a typical individual accredited investor, LS's 8-12% at LOW risk often delivers better outcomes than VC's 18.5% average at VERY HIGH concentrated risk. The categories solve different objectives — allocation choice depends on specific risk tolerance and access level.
How does private credit compare to life settlements in the risk-adjusted framework?
Private credit and life settlements both target 8-12% yields and both rank near the top of the risk-adjusted framework (★★★★★ for LS, ★★★★☆ for private credit). The structural difference comes down to how each delivers returns and what risks each requires. Private credit delivers monthly interest payments throughout the 2-5 year commitment period — immediate cash flow, lower duration. Risks: borrower credit conditions (defaults spike during recessions), interest rate movements affect new originations, fund manager selection matters materially. Life settlements deliver contractual death benefit at policy maturity (5-10 year hold) — larger back-end payment, zero interim cash flow from the LS position itself. Risks: longevity extension (insured outlives LE, extending premium payments), carrier credit (specific carrier failure), servicing (policy management during hold). Both categories play legitimate roles in a risk-adjusted sleeve — most accredited investors deploy across BOTH, allocating LS for the structural zero-correlation diversification anchor and private credit for interim cash flow during the LS hold period. See our 8-12% returns comparison guide for the full category breakdown at this yield tier.
What are the minimum investments for high-yield alternative categories?
Minimums vary significantly by category and specific vehicle. Typical minimums for 2026: life settlements direct ownership ($250K per policy at HYV), private credit funds ($25K-$250K depending on fund), real estate syndications ($25K-$100K per deal), PE buyout funds ($250K-$1M per commitment, often with annual capital calls over 3-5 years), growth equity funds ($250K-$500K), ground-up development syndications ($50K-$250K), venture capital funds ($100K-$1M depending on tier). The practical minimum for building a diversified high-yield alternative allocation is around $250K-$500K, which allows deployment across 2-3 categories at meaningful position sizes. Investors deploying $1M+ gain access to institutional-tier options including top-quartile PE funds and multi-policy LS LE ladders. See our deployment guides for $250K entry, $500K balanced, and $1M institutional frameworks.
Can I combine multiple high-yield alternative categories in one portfolio?
Yes — most sophisticated accredited investors deploy across multiple high-yield categories simultaneously rather than concentrating in any single one. The framework for combining categories should prioritize risk-adjusted scores: anchor the allocation with ★★★★★ and ★★★★☆ categories (life settlements, private credit, RE syndications core) for the bulk of exposure, then add measured allocations to ★★★☆☆ and lower-ranked categories (PE buyouts, RE value-add) based on specific objectives and risk tolerance. A typical balanced high-yield allocation might include: 40-50% life settlements (optimal risk-adjusted anchor), 20-25% private credit (interim cash flow + low-moderate risk), 15-20% real estate syndications (hard asset backing + depreciation shielding), and 10-15% in higher-yield categories (PE buyouts, value-add RE) for growth tilt. The specific percentages depend on individual risk tolerance, income needs, hold-period preferences, and existing portfolio positions.
Start with the ★★★★★ risk-adjusted entry
Two paths to begin: browse currently available life settlement policies to see the optimal entry quadrant firsthand, or schedule a consultation to walk through the 8-category framework applied to your specific risk tolerance and yield objectives.
Or call (833) 250-9677